Noble Schools’ annual report for the 2021-2022 school year is now out! The report gives an overview of the students and families we served and the results of that service.
Two of the areas where we found we excelled the most were Noble League and supporting DREAMer students with college. Take a look below to see a quick snapshot of the success we saw for our Noble League participants and DREAMer students in 2021-2022.
NOBLE LEAGUE
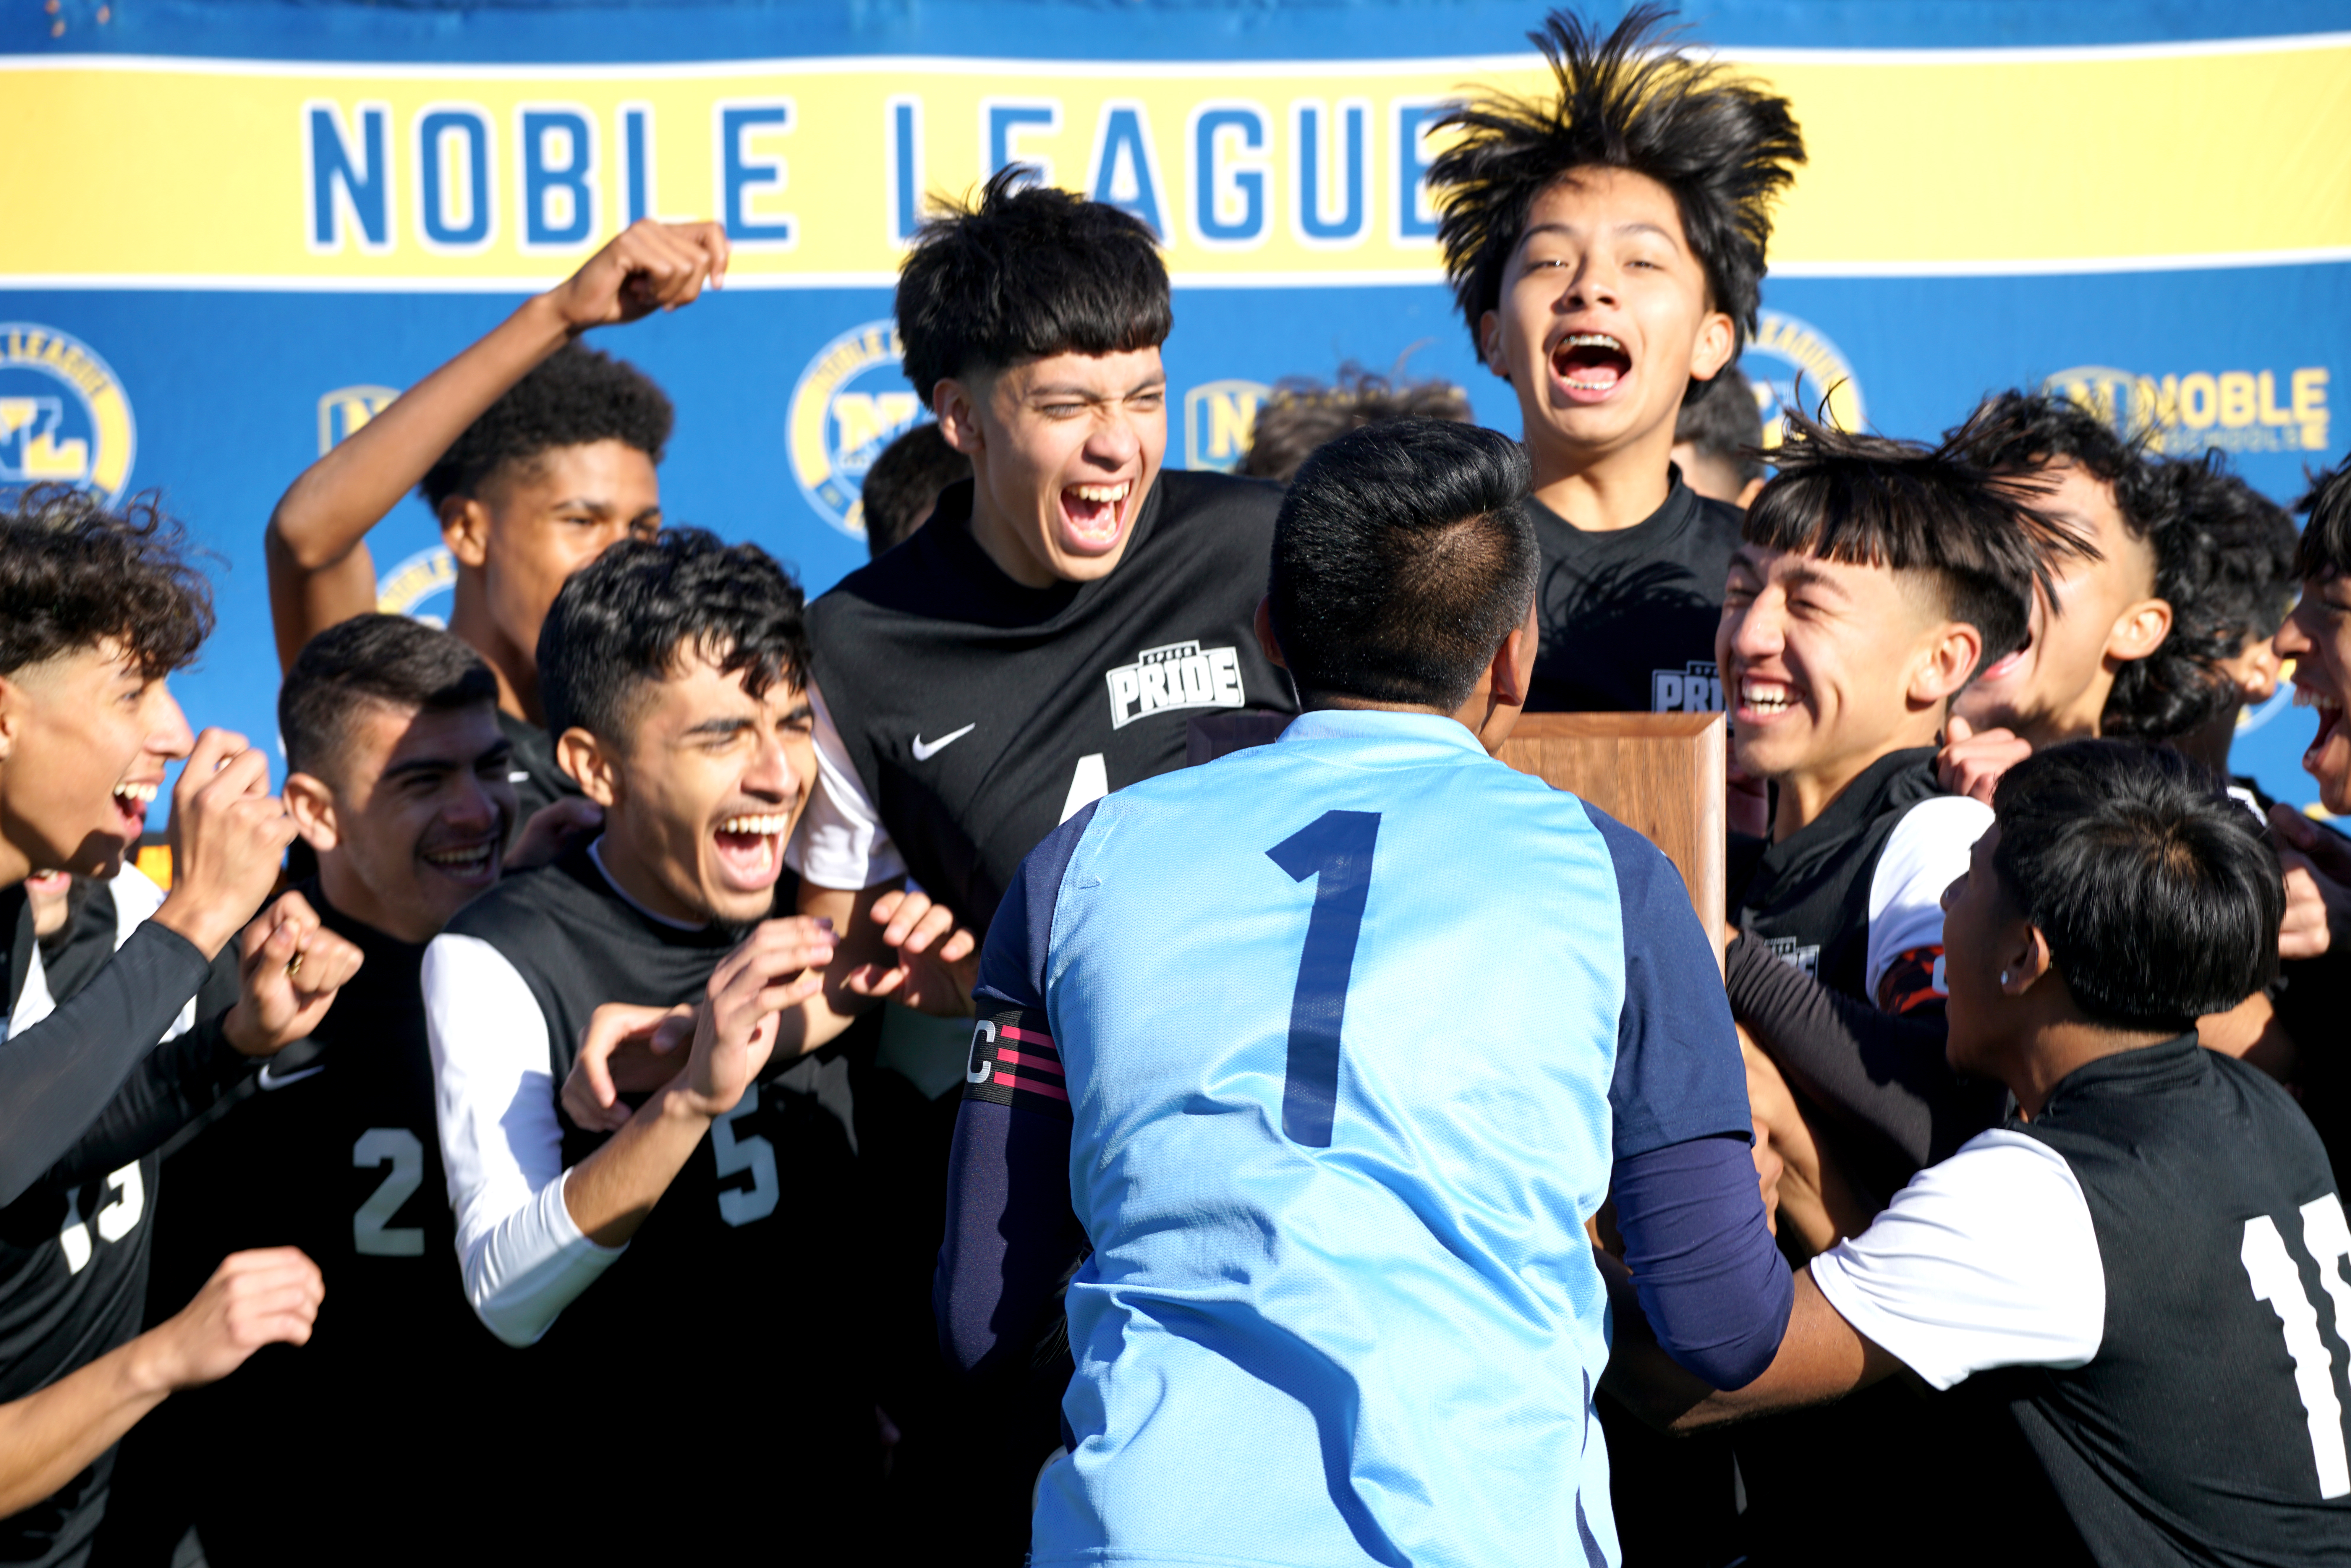
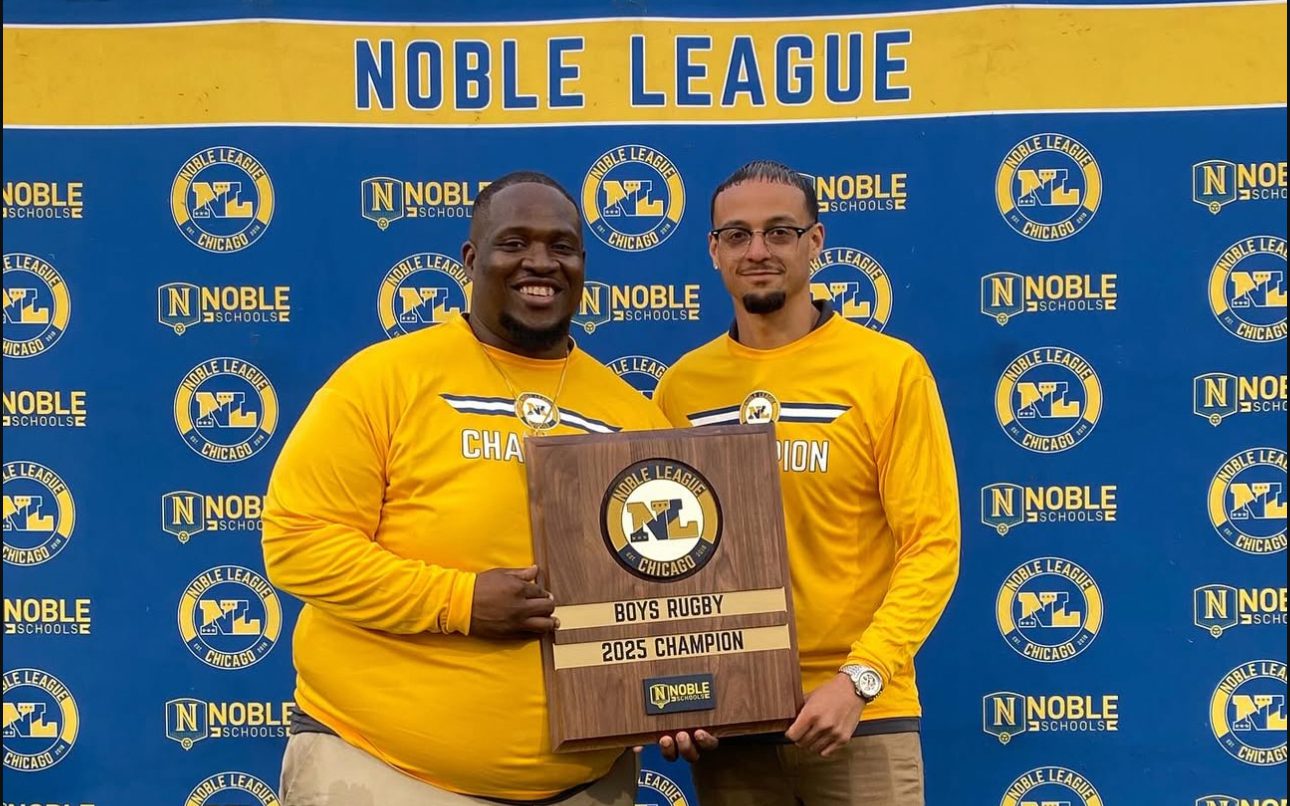
Last year, approximately 3,000 students participated in the Noble League, the competition mechanism of the network’s athletics, fitness, academics, and the arts. We have more than 150 head coaches and facilitate over 1,500 athletic contests annually.
We saw that participation in the Noble League was linked to positive student performance across a range of outcomes:
-
On average, Noble League participants have higher current and cumulative GPAs, fewer absences, and fewer disciplinary infractions than students who don’t participate.
-
A 2016-18 study also indicated that Noble League participants had higher projected college graduation rates and higher college retention rates than non-participants.
Additionally, Butler College Prep set new heights in Noble League athletics in 2022.
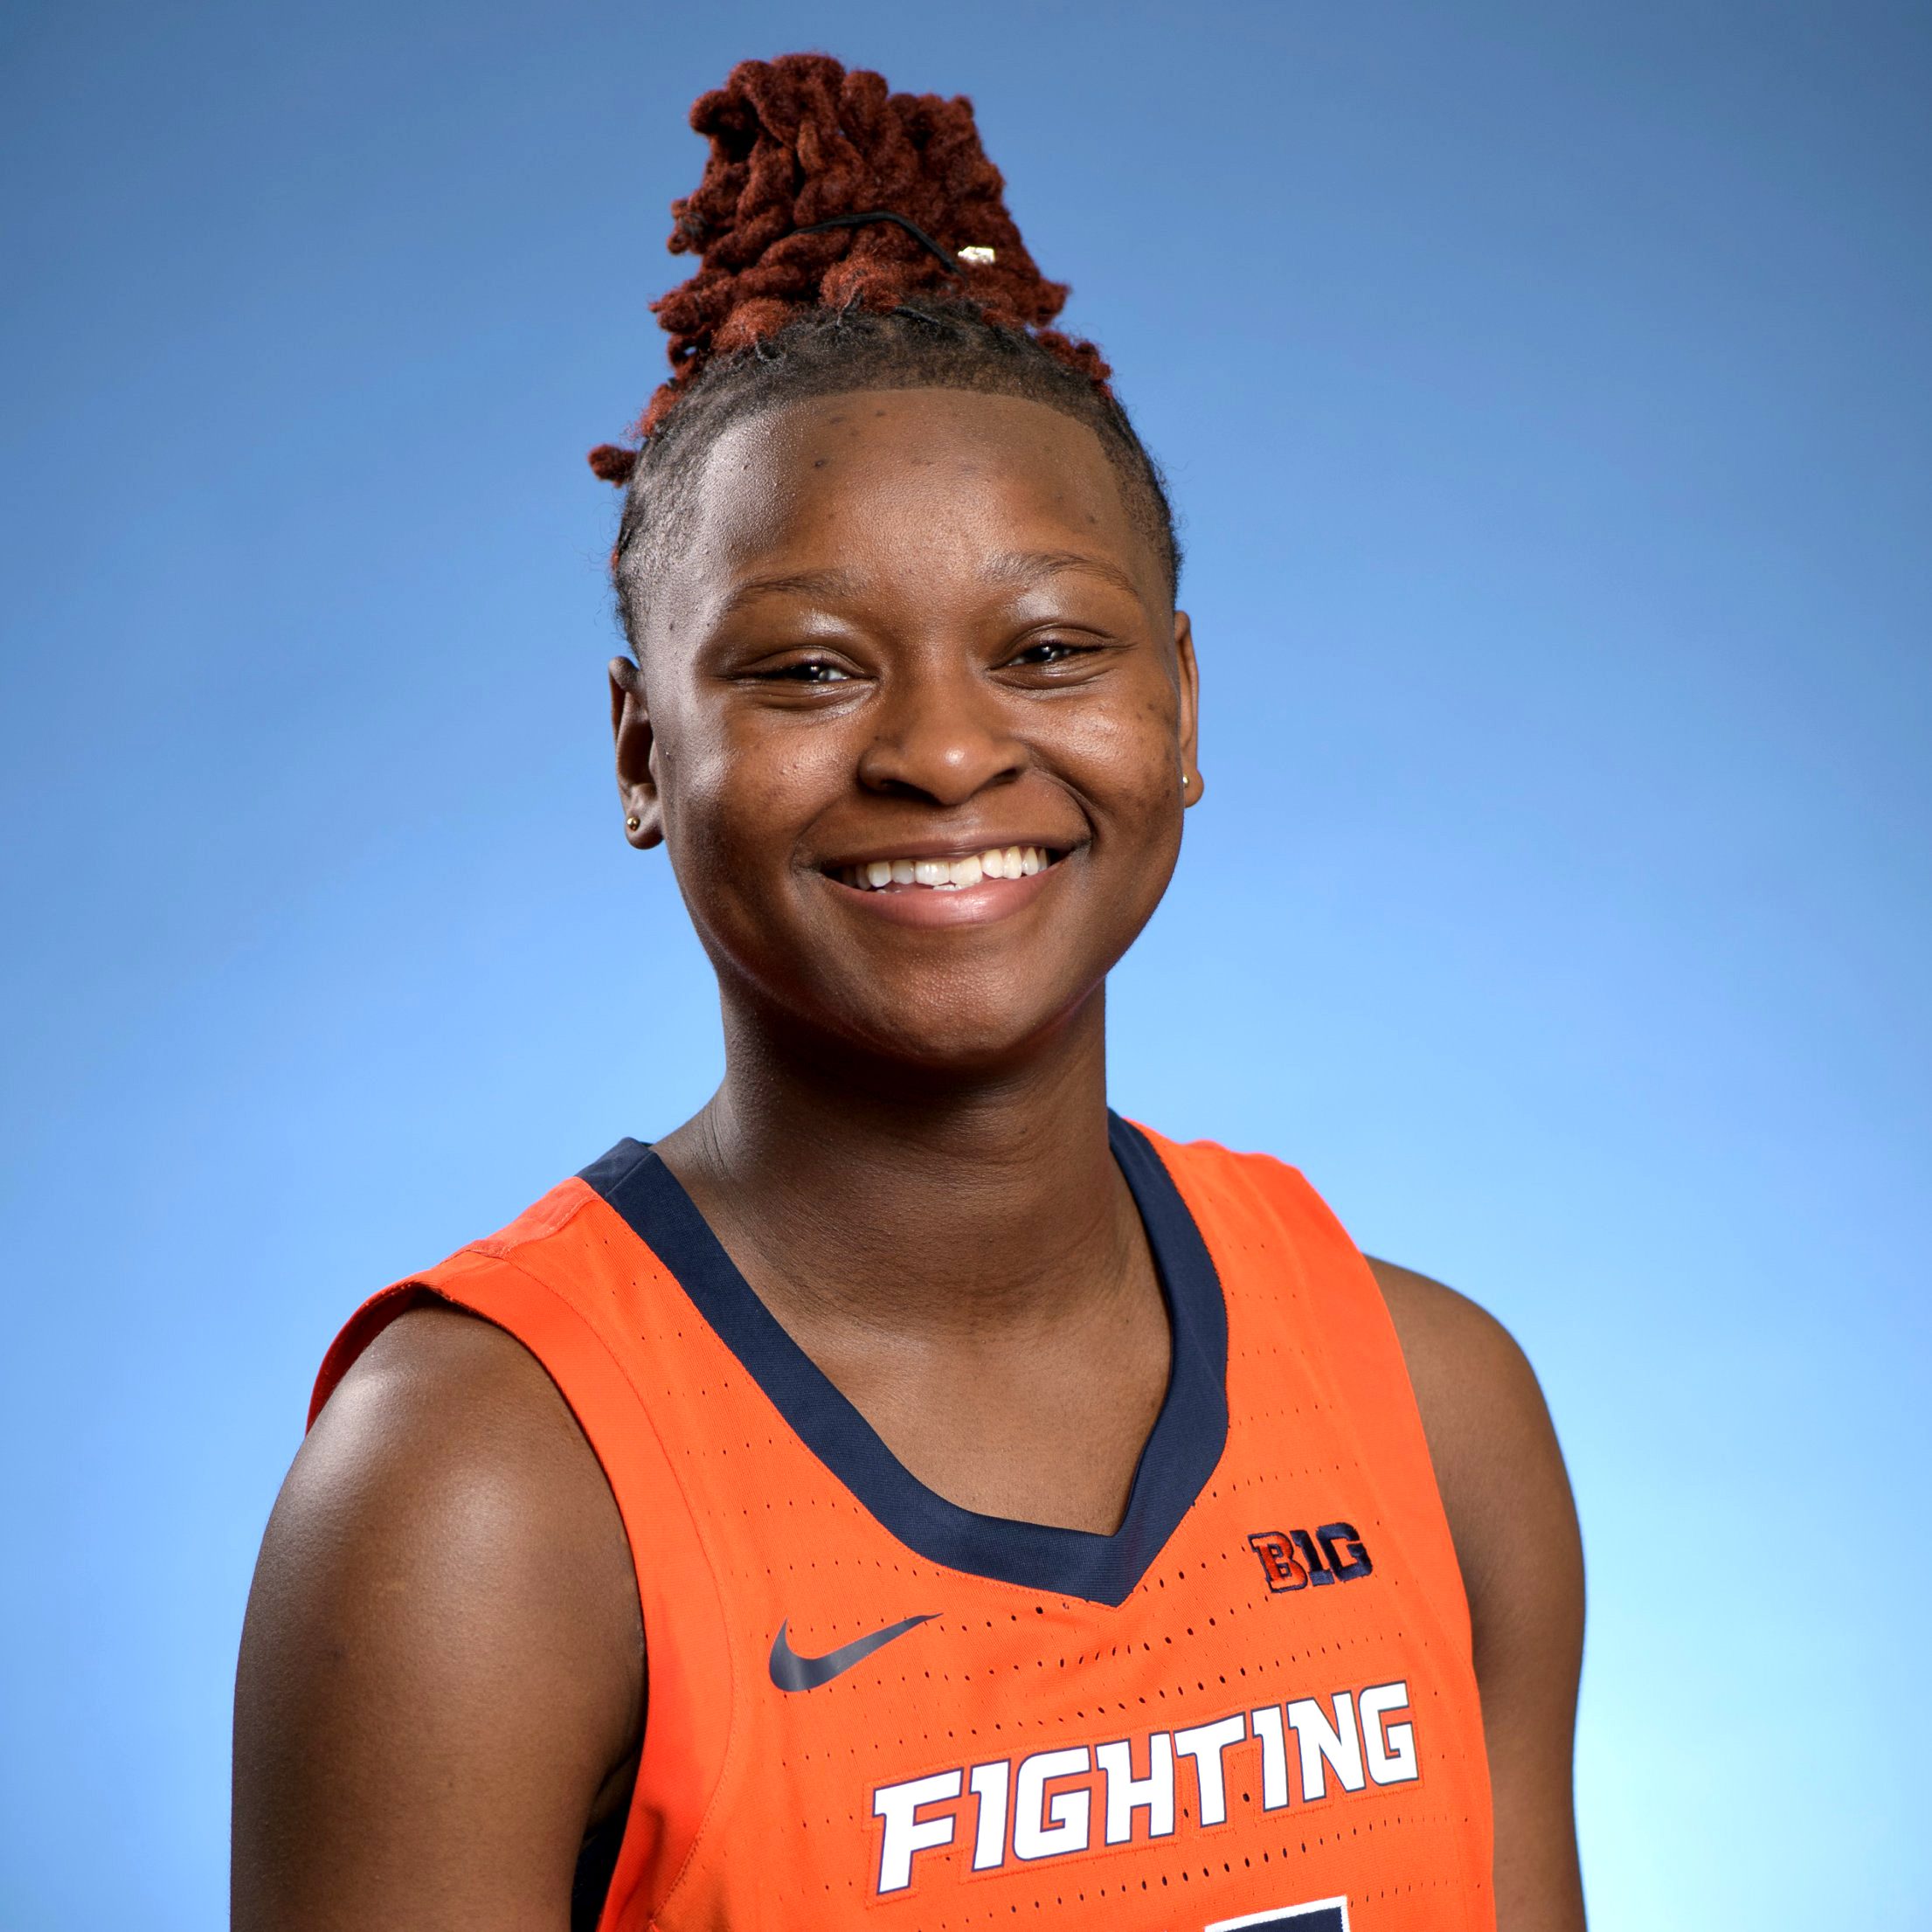
Camille Jackson, Butler College Prep’s all-state guard, became the first Noble League athlete to accept a full-ride athletic scholarship to a Power 5 NCAA Conference. Camille helped lead the Lady Lynx to an IHSA Super-Sectional appearance, also a first for Butler girls’ basketball. Camille is now a freshman guard for the Illinois Fighting Illini.
DREAMER SUPPORTS
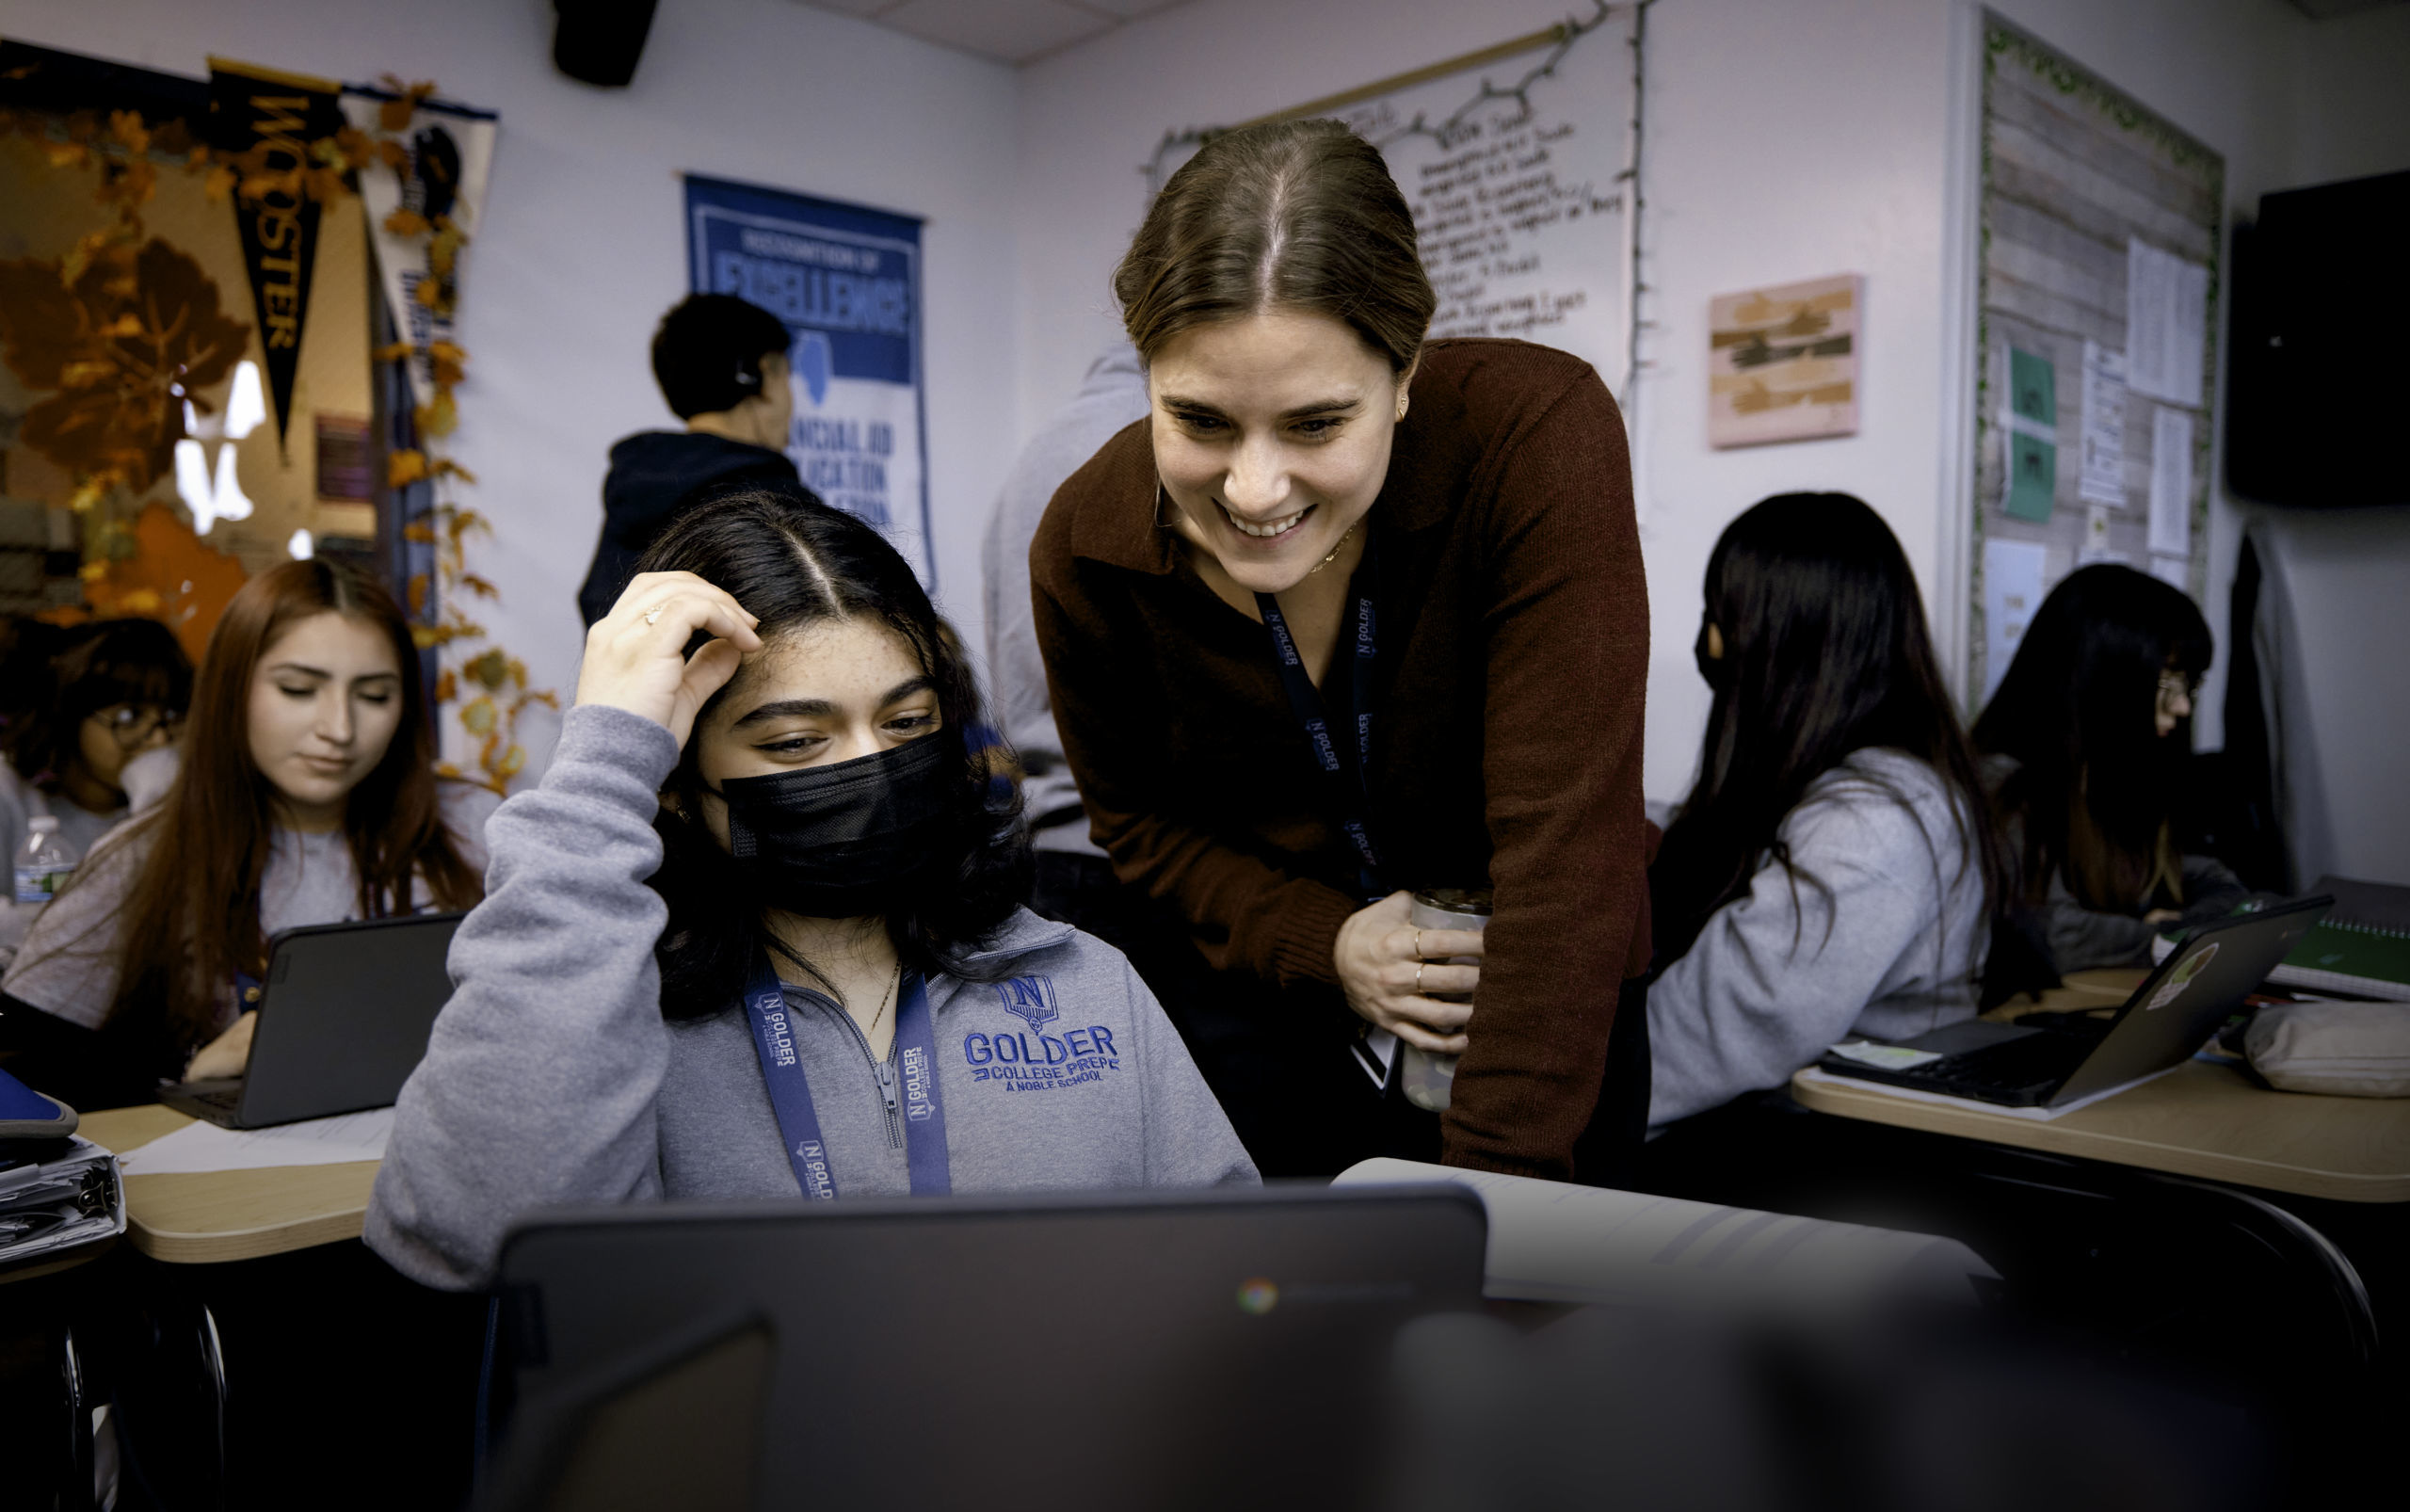
Noble is helping change the trajectory of the lives of students and their families for generations to come, and this includes DREAMer, DACAmented and mixed-status students. Since we established the Office of DREAMer Supports in 2015, we’ve seen unprecedented increases in the rates of this population of students attending and graduating from college.
Funding partnerships contribute to DREAMer student college enrollment.
Prior to 2015, only about 1 of every 4 DREAMer Noble graduates matriculated immediately to a 4-year college. Now, more than 3 out of 4 of this same population is enrolling in a 4-year college. We credit this increase in large part to the Pritzker Access Scholarship and other donor-supported partnerships.
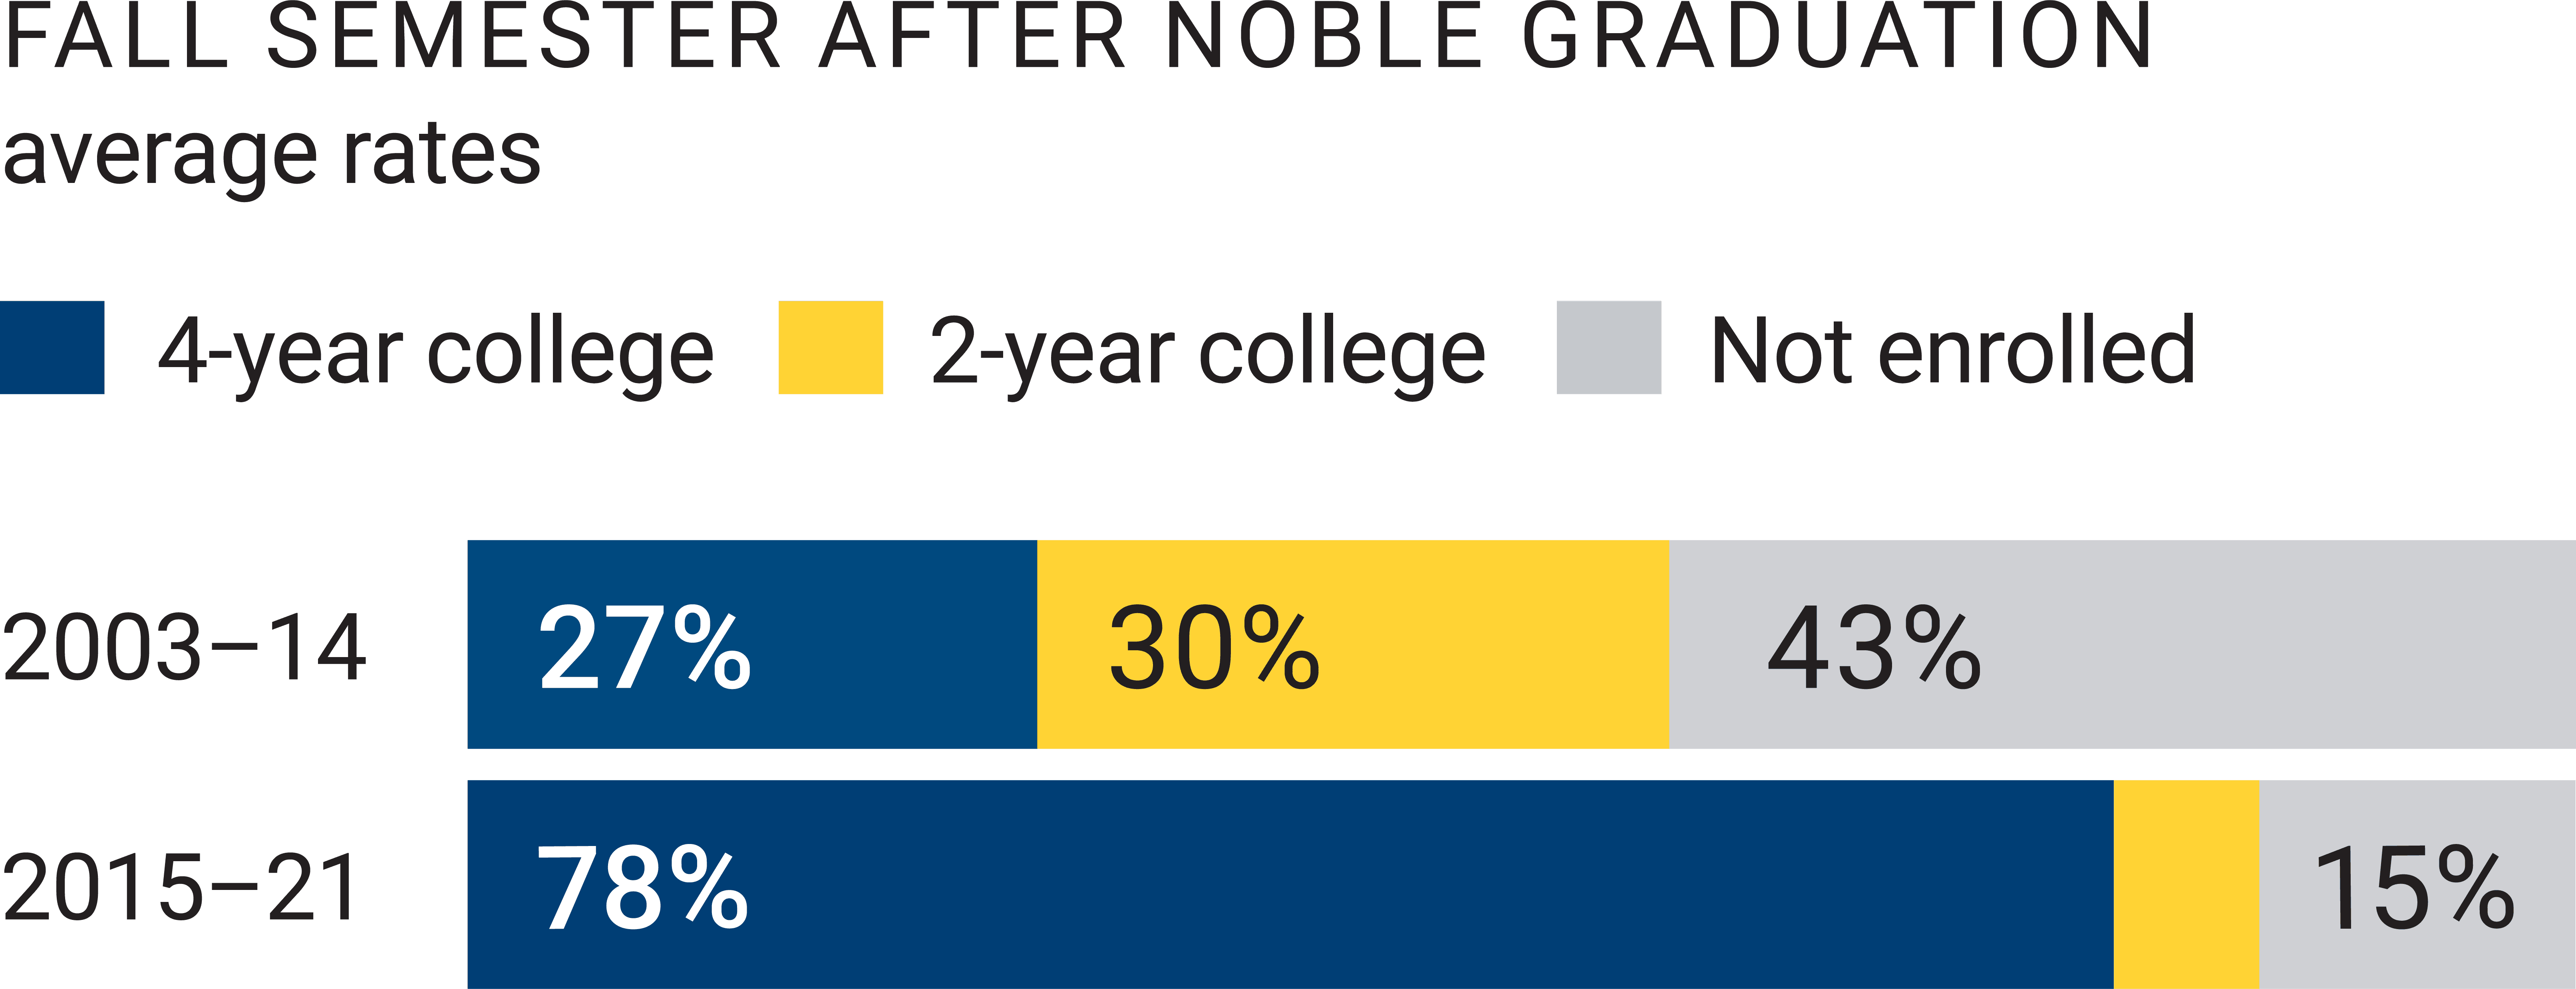
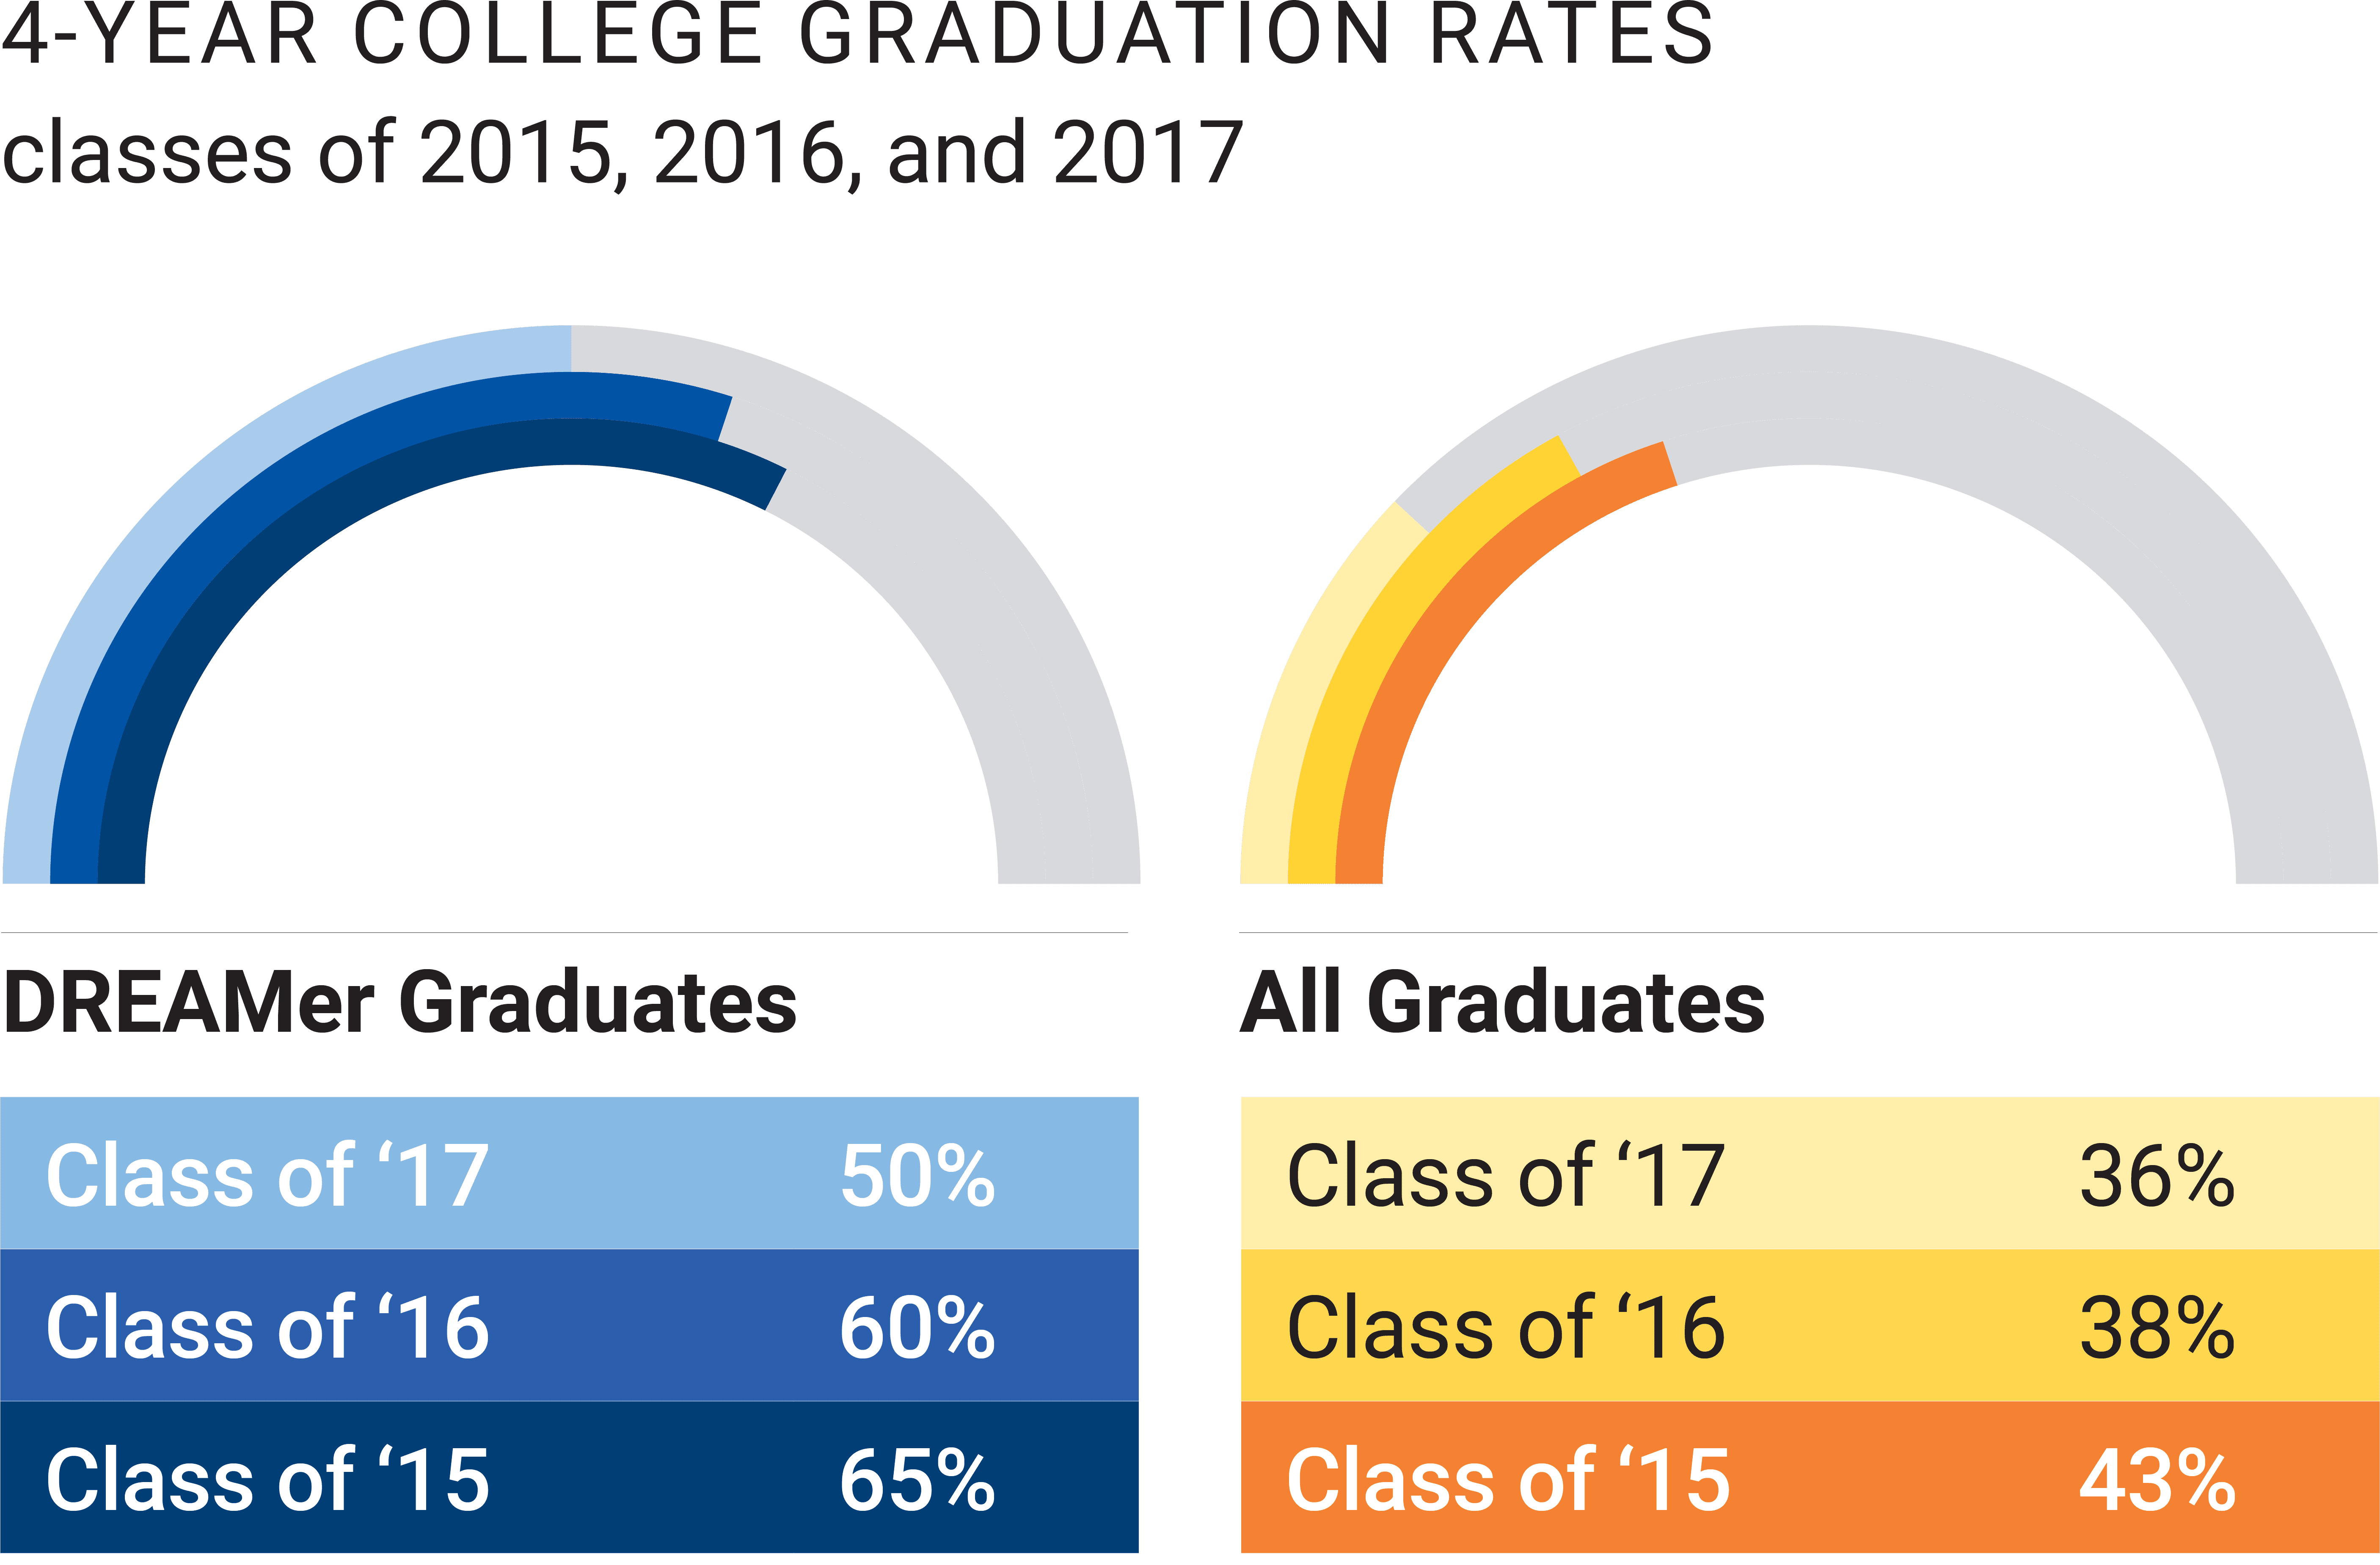
Noble’s DREAMer alumni are graduating
college at higher rates than their peers.
