SUMMARY
The Family Experience Survey aims to consistently elevate the parent and family voice.
As we continue to become an antiracist organization, we must integrate the voice of Noble families into our work. The data in this document is for all Noble Schools. Campus-specific data will be shared in PAC meetings throughout the Spring. Here, we outline what we heard from our families across all of our schools about how we are executing our shared mission and values.
BACKGROUND OF RESPONDENTS
A total of 3,886 family respondents provided critical feedback.
RACE/ETHNICITY
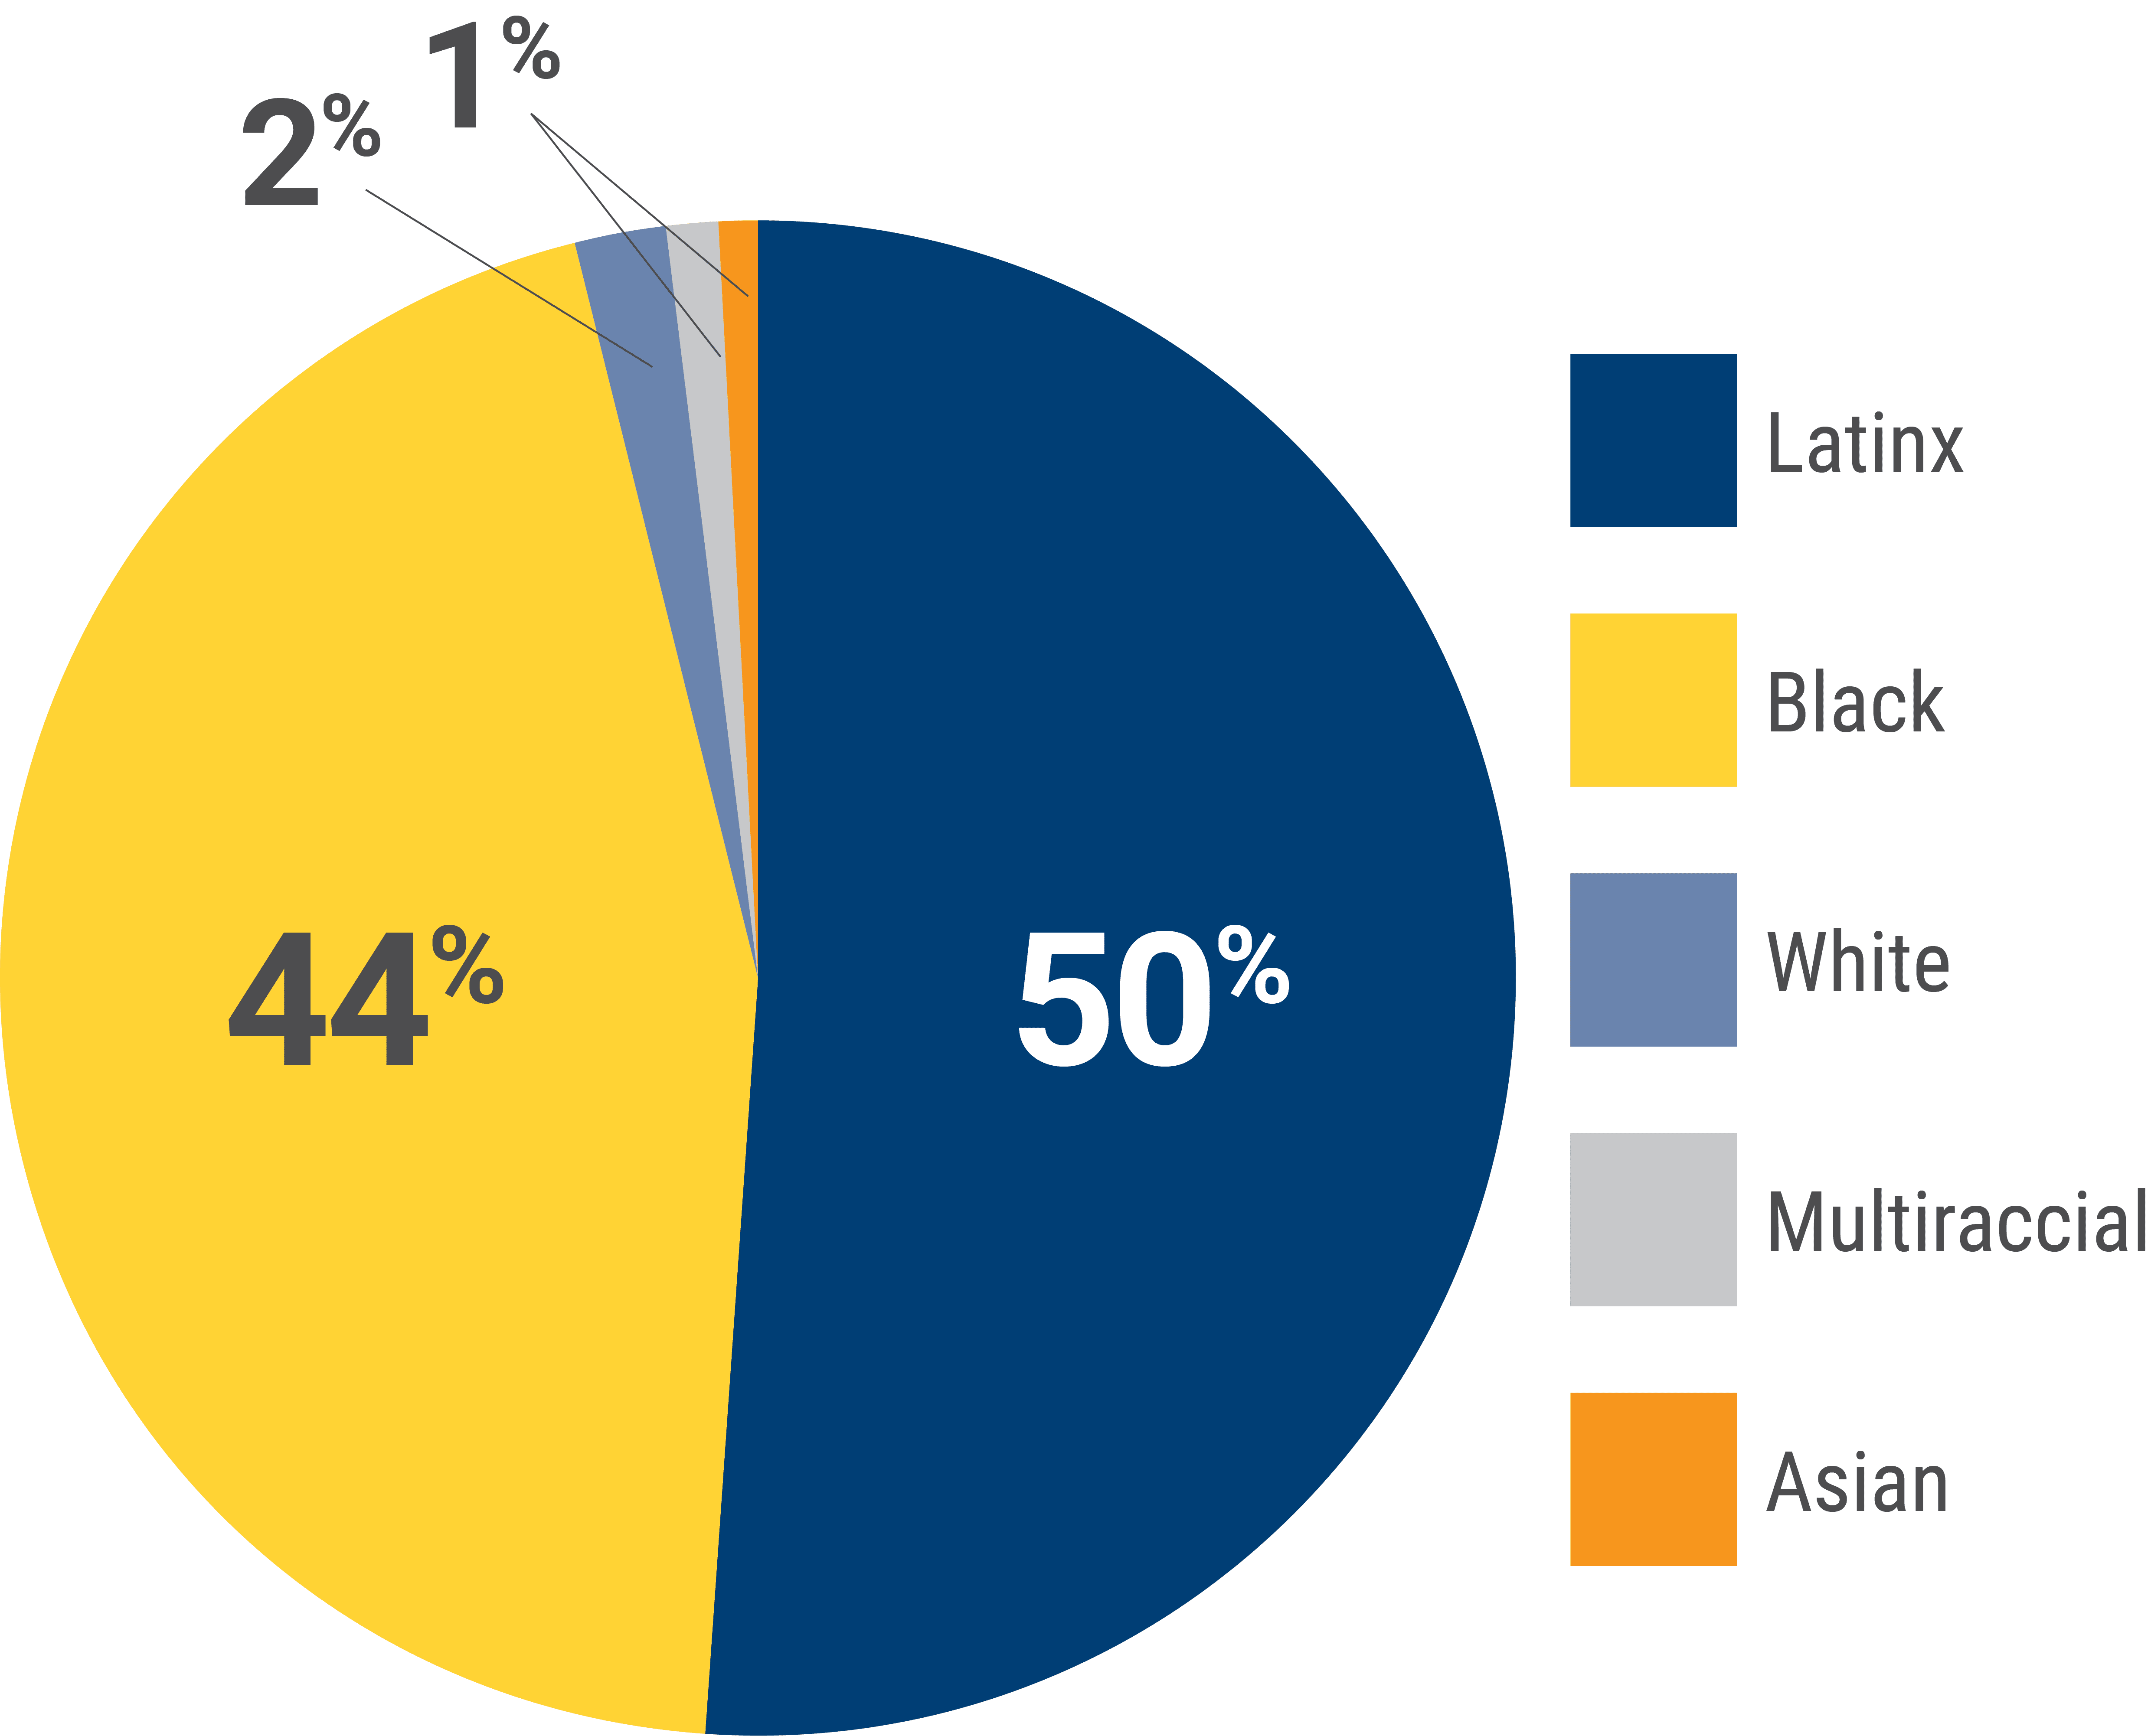
50% identified as Latinx, 44% as Black, 2% as Multiracial, 1% as White, and 1% as Asian
GRADE LEVEL OF OLDEST CHILD
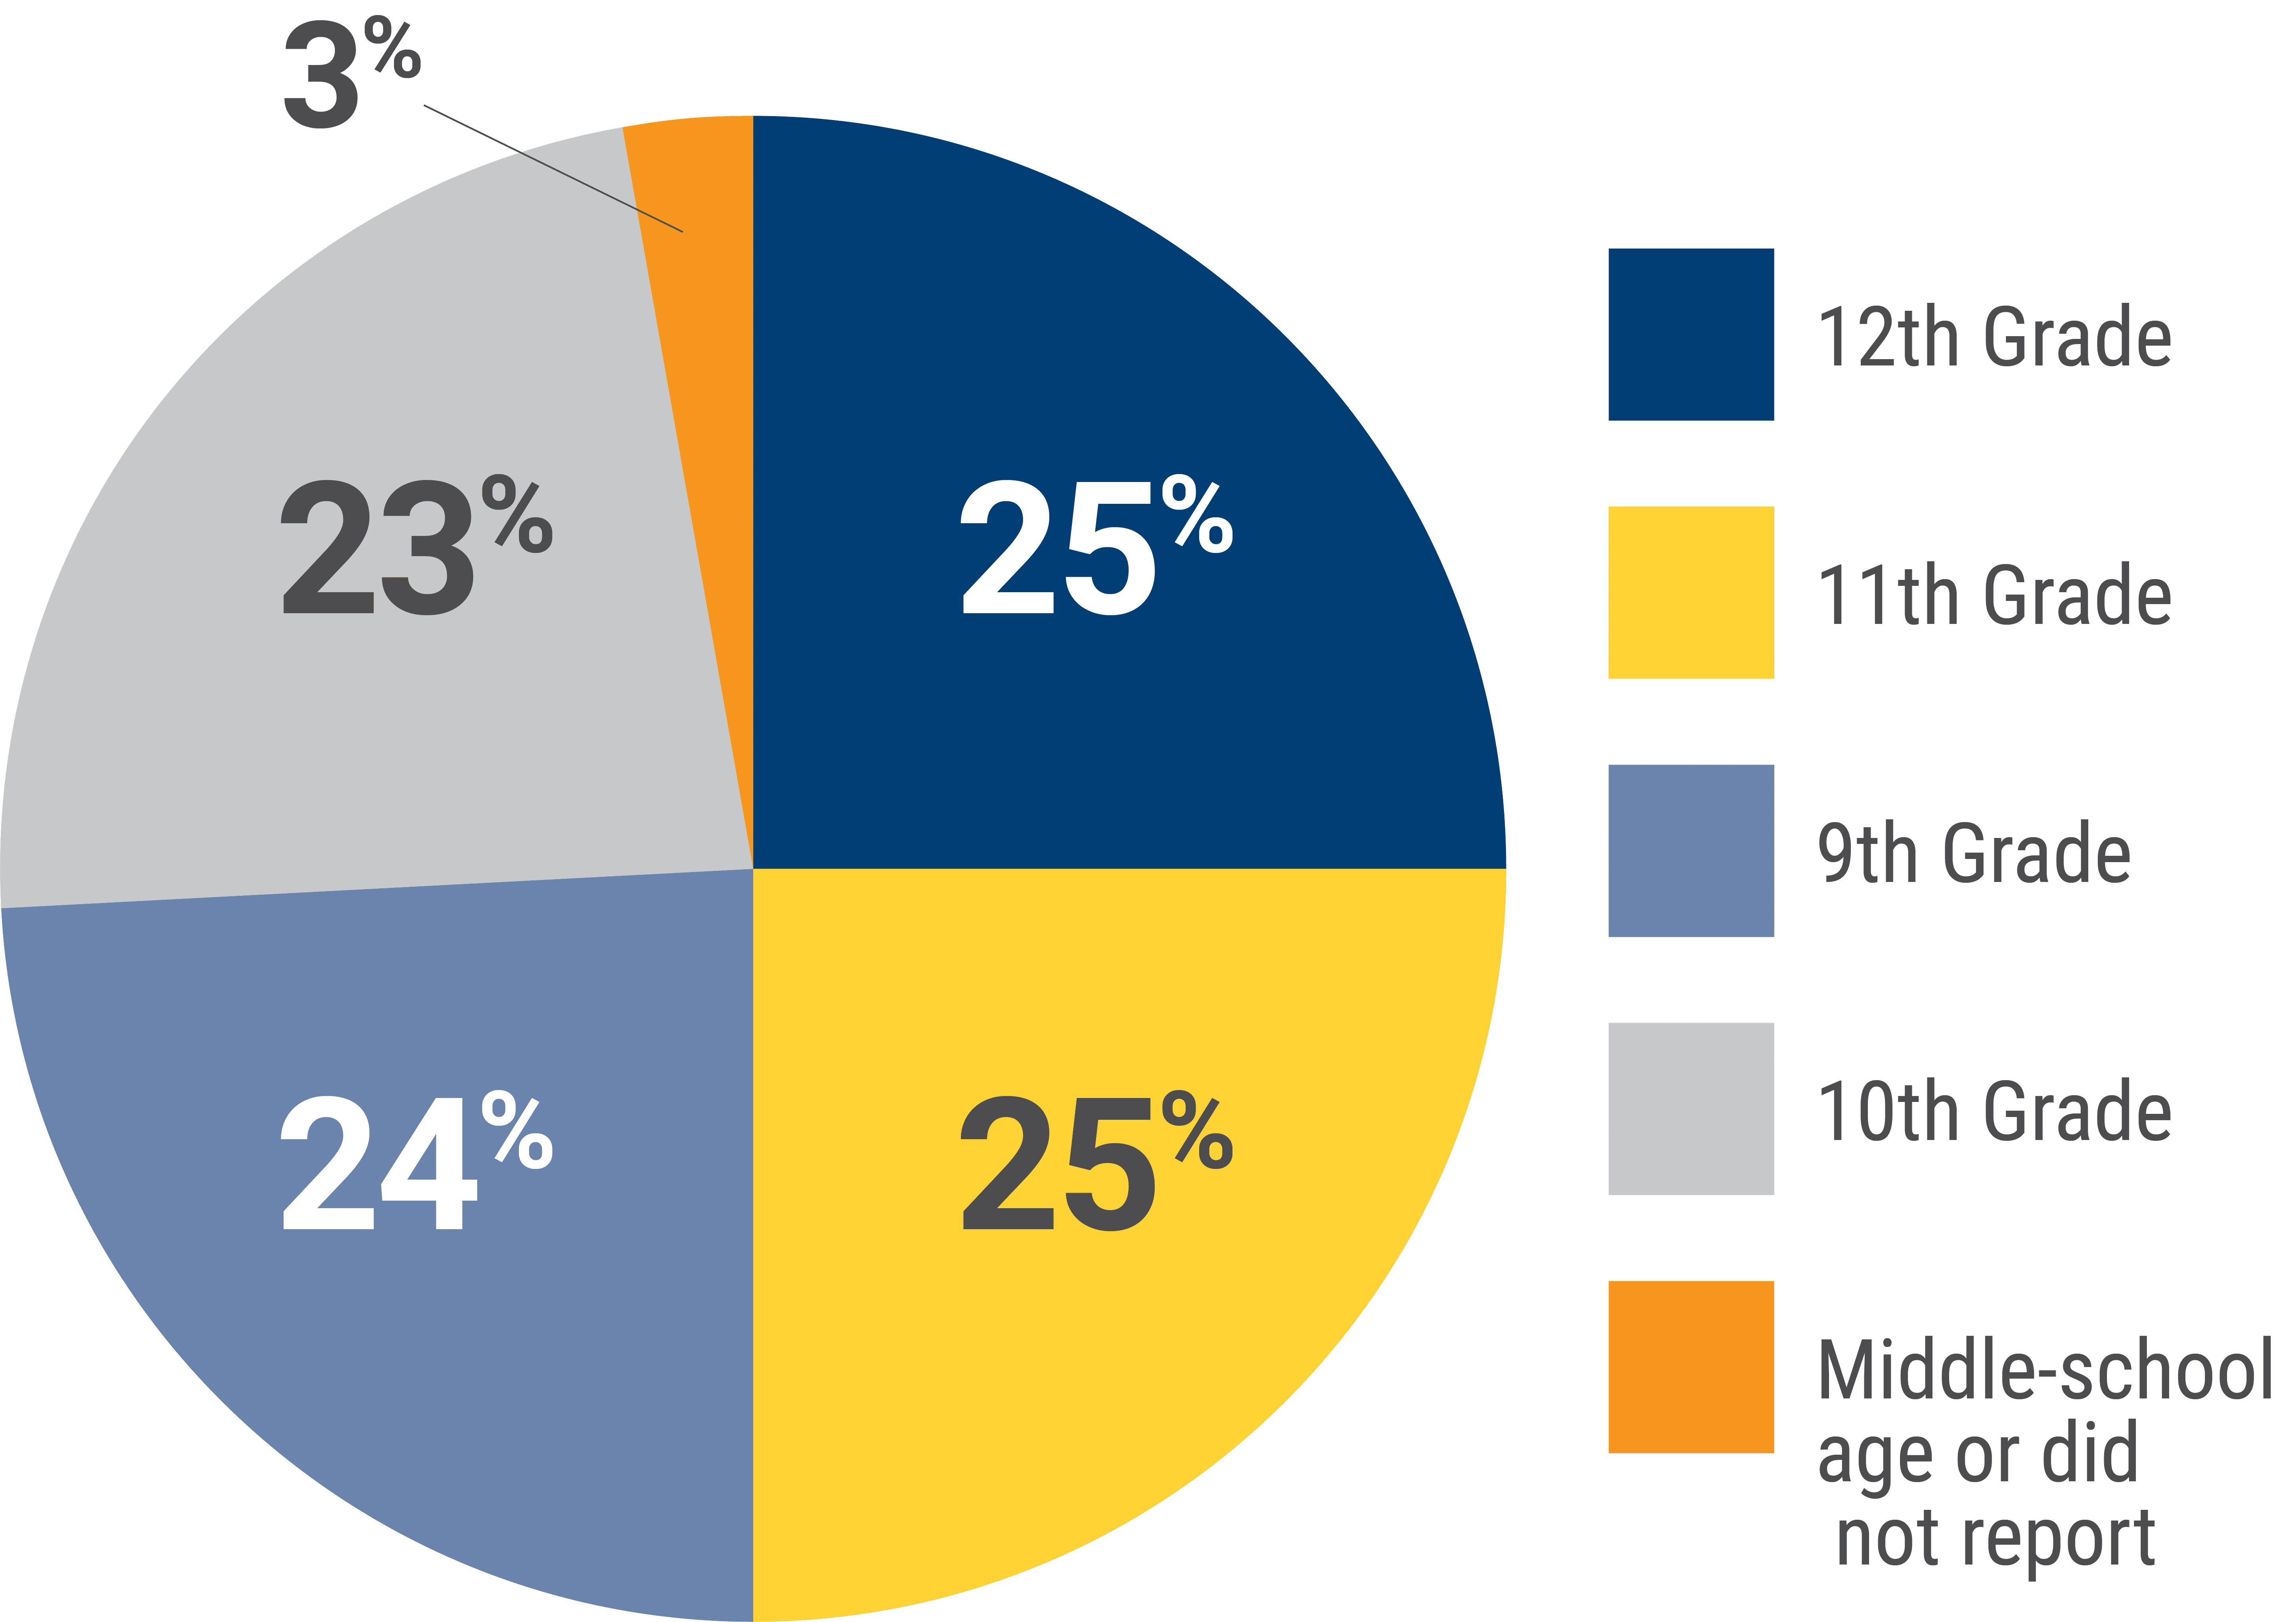
The grade level of respondents’ oldest children were evenly split across the high school grades.
3% of responses were from Middle School parents, which is about the same proportion of middle school students in the network (2.4%).
The survey consisted of questions on the topics listed below.
Here are some of the themes:
ACCOUNTABILITY & CULTURE
Nearly 9 in 10 families agree that their child’s school culture is predictable, consistent, and promotes learning.
SCHOOL CLIMATE
Over 7 in 10 families feel administrators create a school environment that helps their children learn.
SCHOOL SAFETY
The majority of families worry about violence in schools; however, over 6 in 10 families believe their child generally feels safe in school.
SCHOOL FIT
3 in 4 families feel their school is preparing their student for their next academic year.
FAMILY ENGAGEMENT
Over 8 in 10 families have at least one trusted staff member at their child’s school.
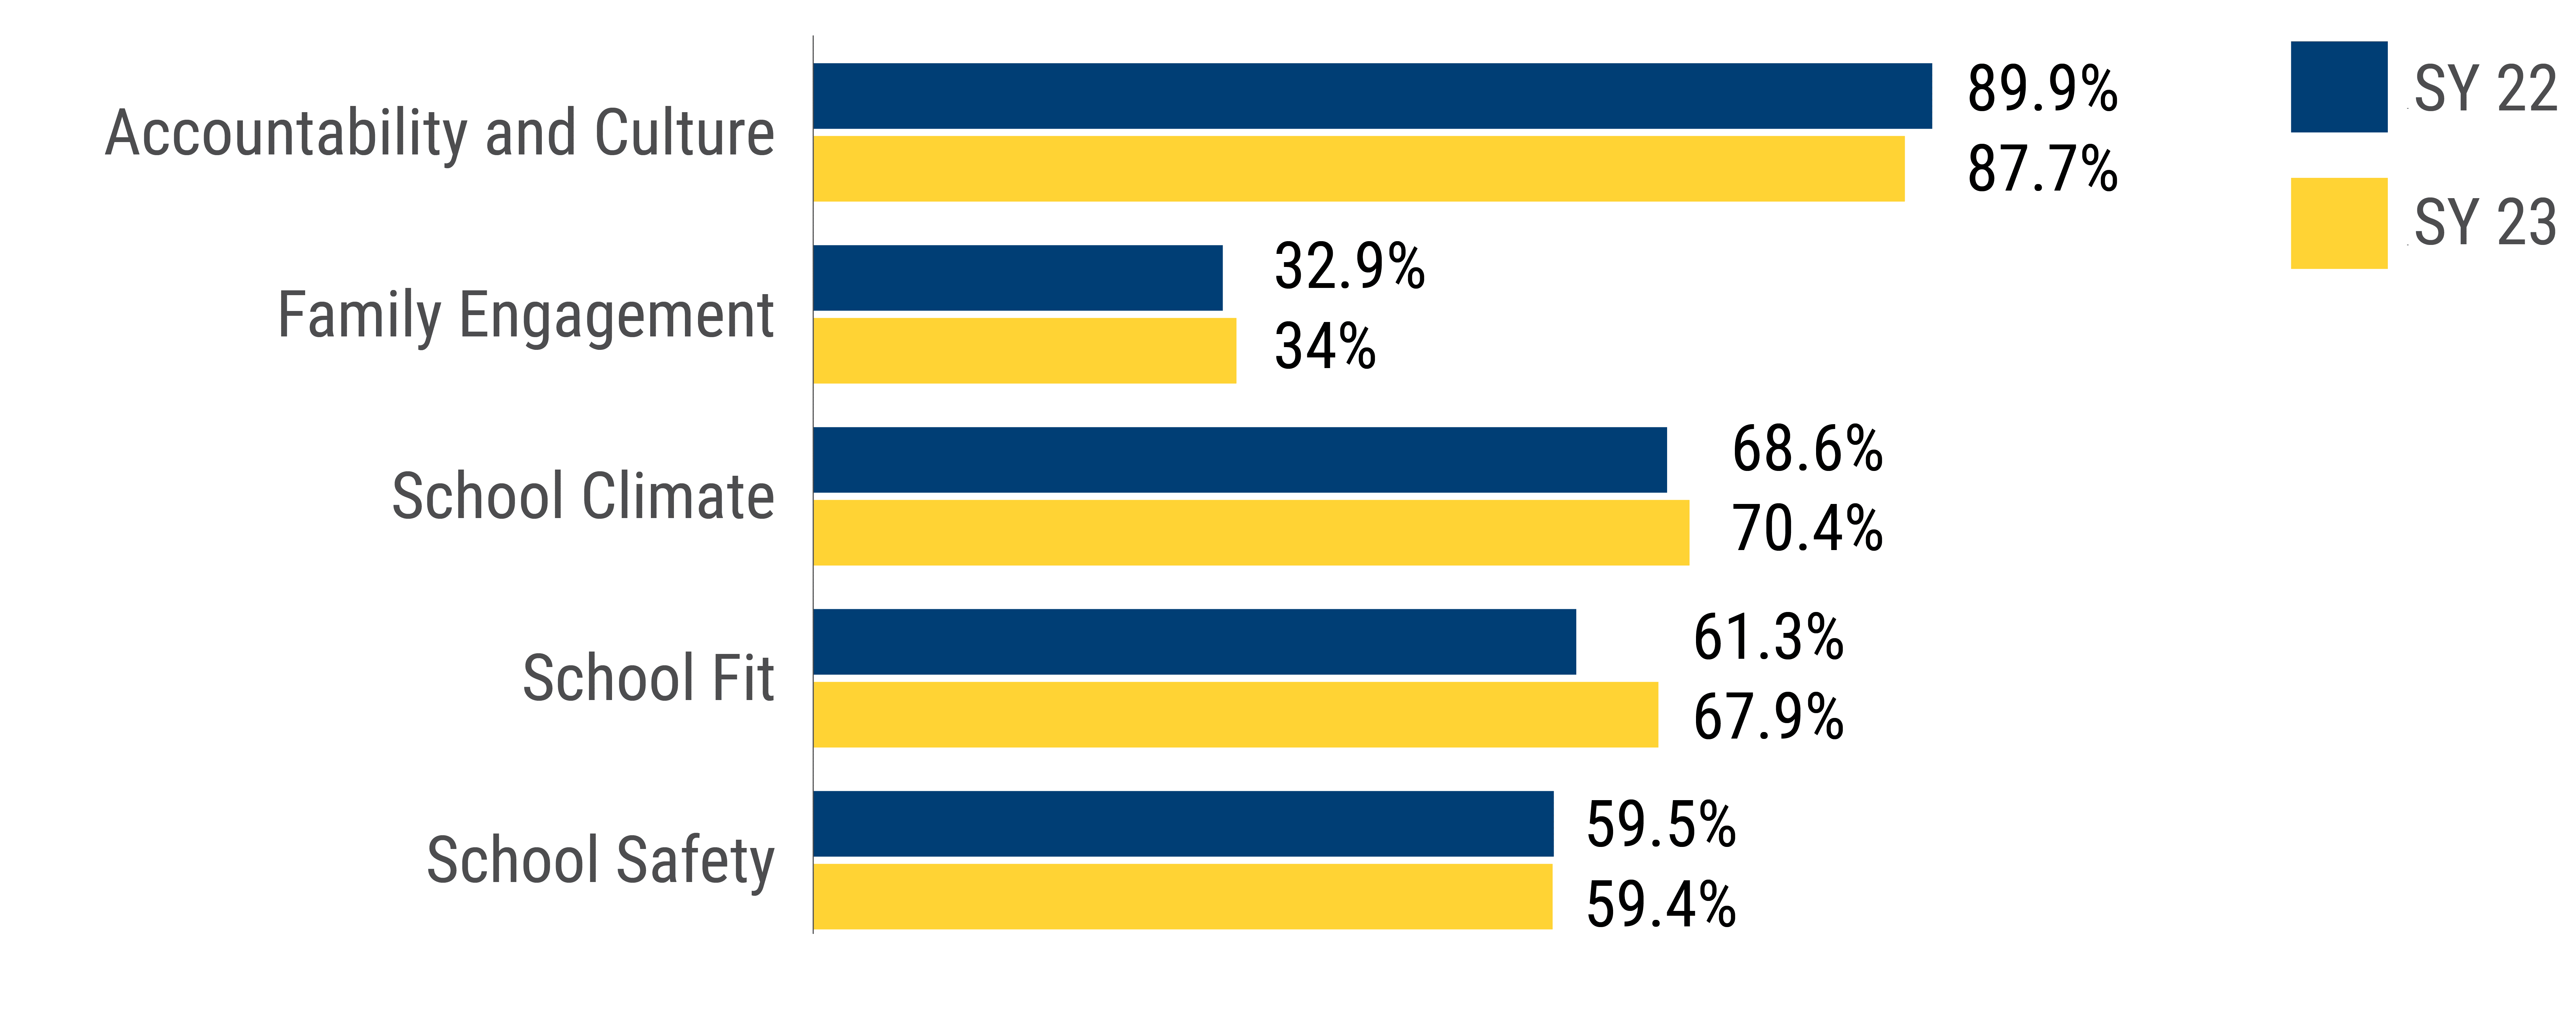
Most question topics had similar favorability as the previous year, with the exception of School Fit, which increased over 6% in favorability – which we define as answering “strongly agree” or “agree” to a question. The lowest topic favorability was once again Family Engagement at 34% (1.1% higher than the previous year), and the highest was again Accountability & Culture at 87.7% (2.2% lower than the previous year).
Within School Safety, parents are worrying less about violence at school than last year (3.3% higher than the previous year) but report that their child feels more unsafe than last year (6.1% lower than the previous year), though the favorability for children feeling safe was still higher than parents’ worrying (64.3% vs 37.9%).
Next Steps
- This document has outlined the data for all families at all schools. To understand the school-specific data, every Principal will be hosting a Parent Advisory Council (PAC) meeting this Spring. Contact your school for more information.
- On April 20, during our Parent Leadership Series, we shared more information about the Network-wide responses to all of the feedback we’ve collected.
- The Public Affairs team will recommend final Family Experience goals for our commitments in the Noble Identity Framework that will guide our work in School Year 2024.
RESUMEN
RESUMEN
La Encuesta de experiencia familiar tiene como objetivo elevar constantemente la voz de los padres y la familia.
A medida que continuamos convirtiéndonos en una organización antirracista, debemos integrar la voz de las familias de Noble en nuestro trabajo. Los datos en este documento son para todas las Escuelas Noble. Los datos específicos del campus se compartirán en las reuniones del PAC durante la primavera. Aquí, describimos lo que escuchamos de nuestras familias en todas nuestras escuelas sobre cómo estamos ejecutando nuestra misión y valores compartidos.
DATOS DEMOGRÁFICOS DE LOS ENCUESTADOS
DATOS DEMOGRÁFICOS DE LOS ENCUESTADOS
Un total de 3,886 familiares encuestados proporcionaron comentarios críticos.
()
RAZA/ETNICIDAD
RAZA/ETNICIDAD
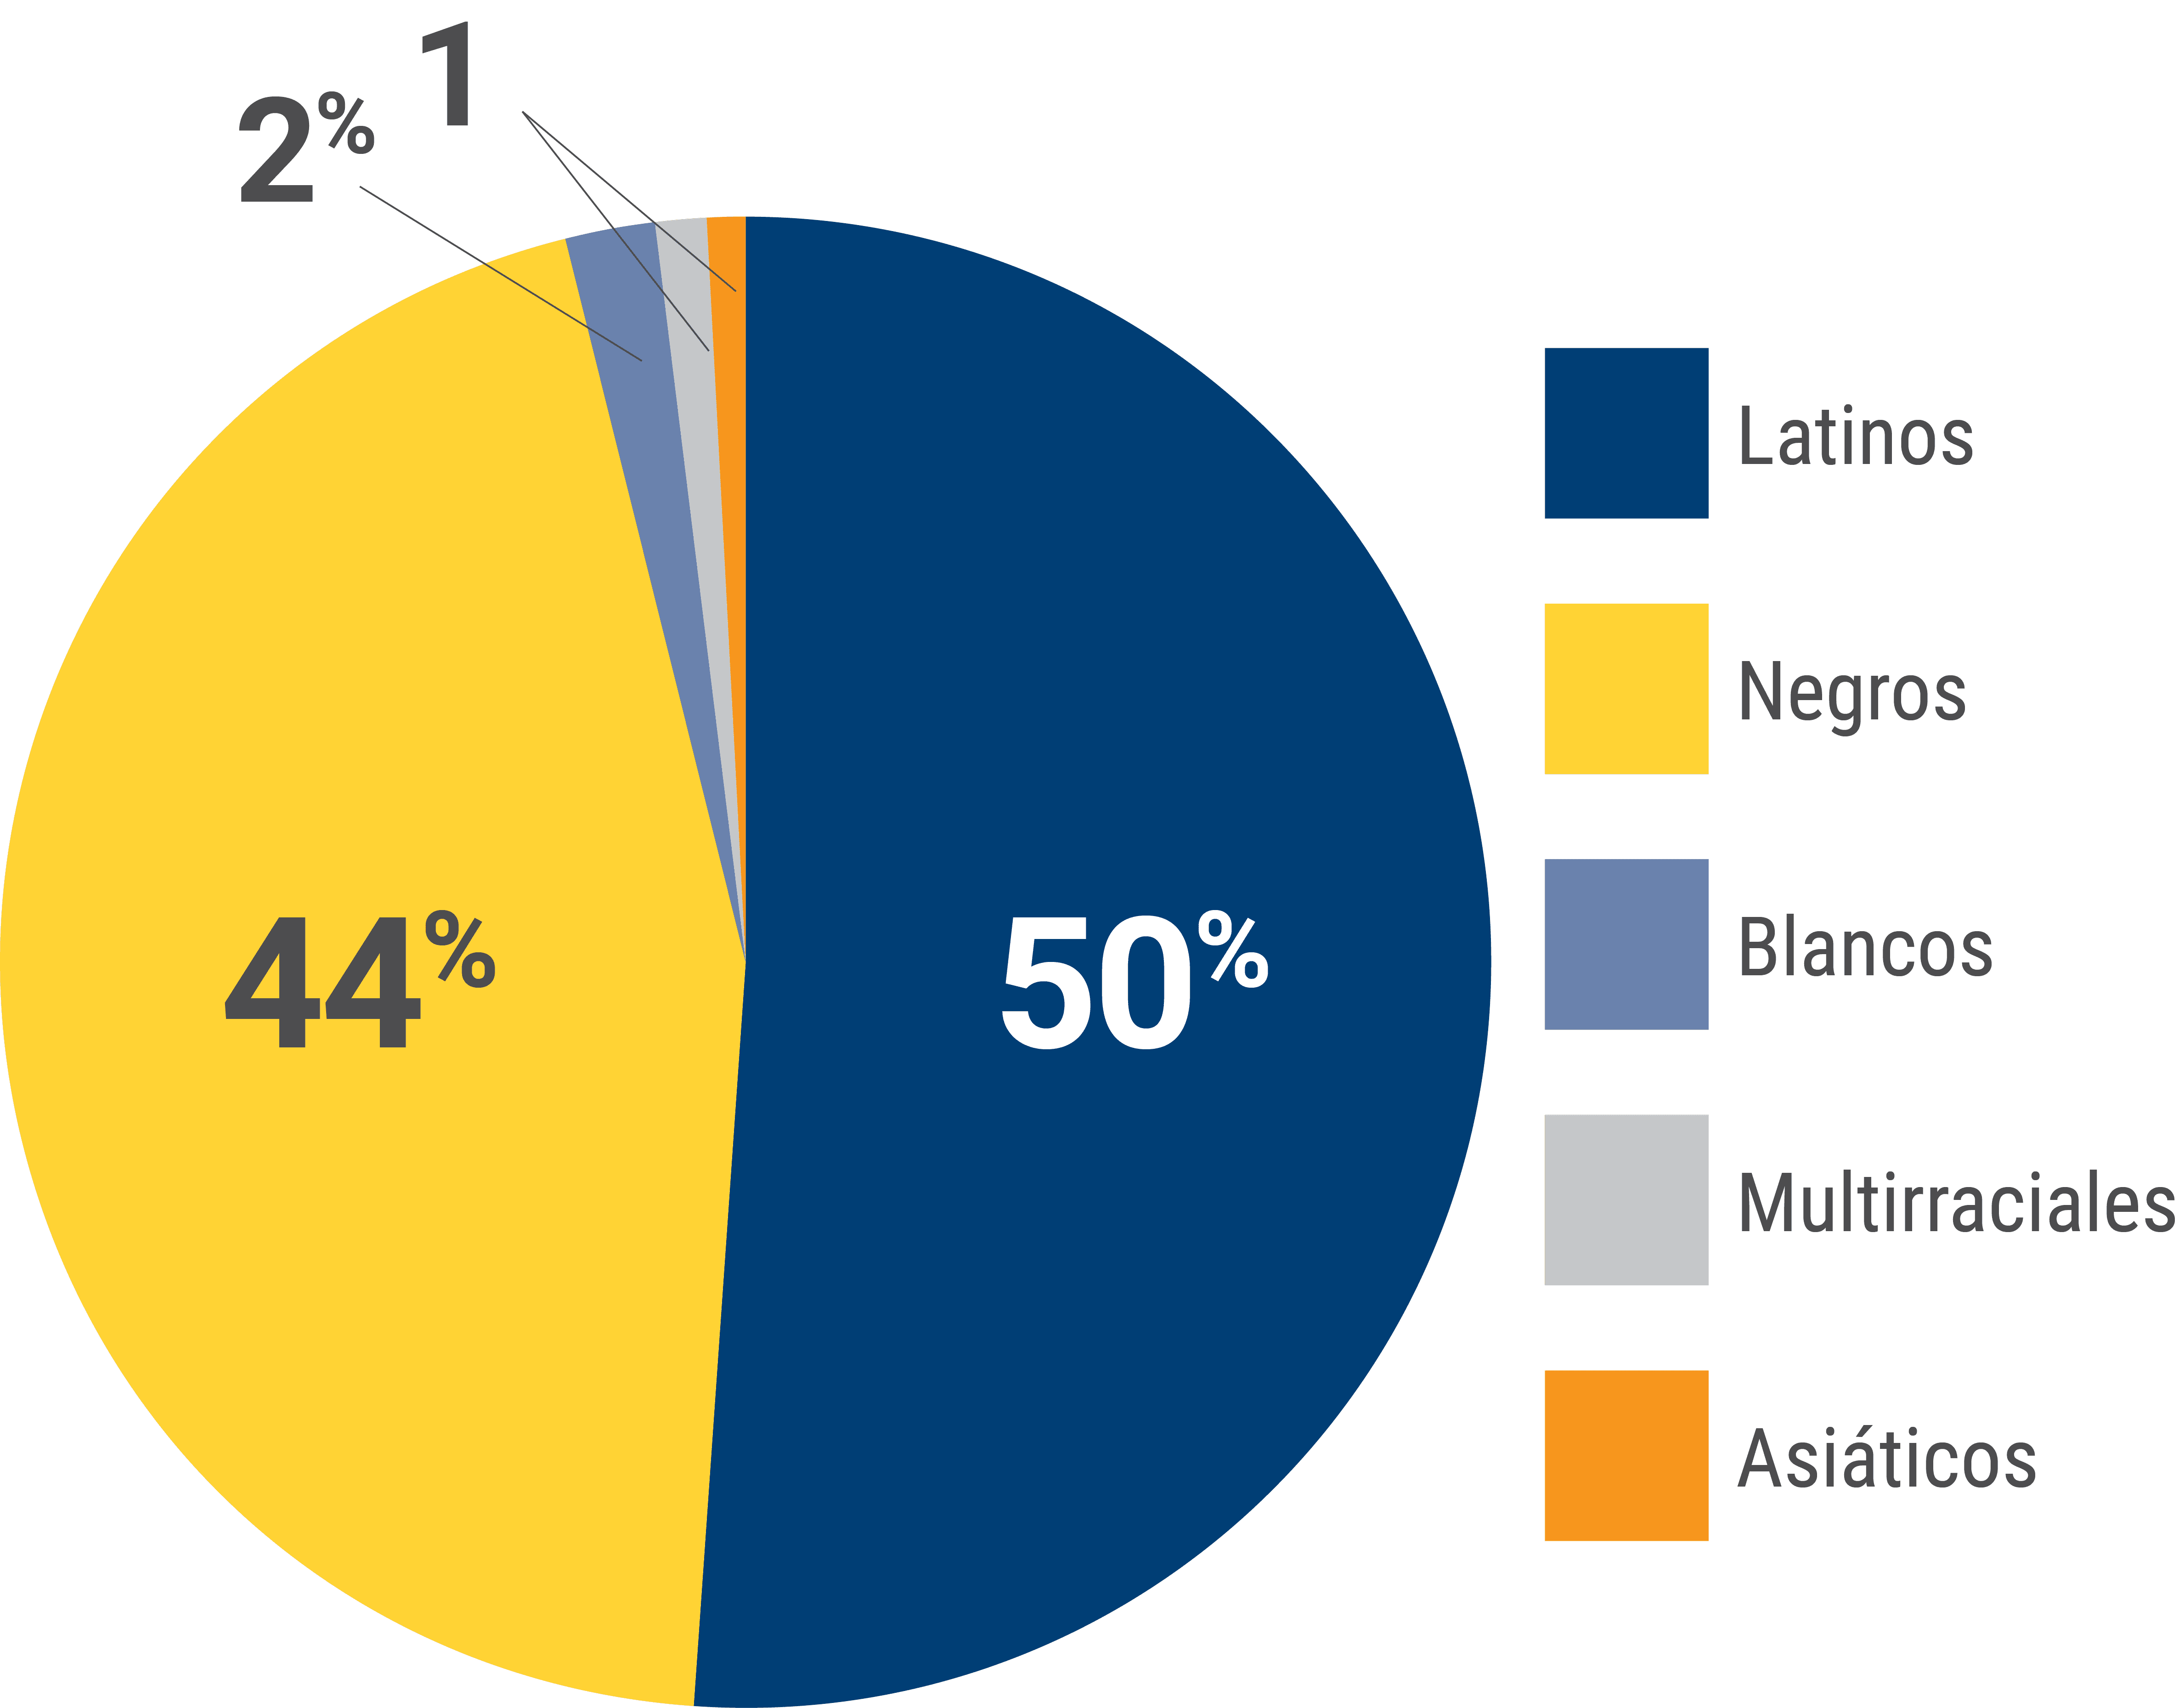
50% identificados como latinos, 44% como negros, 2% como multirraciales,1% como blancos y 1% como asiáticos
NIVEL DE GRADO DEL HIJO MAYOR
NIVEL DE GRADO DEL HIJO MAYOR
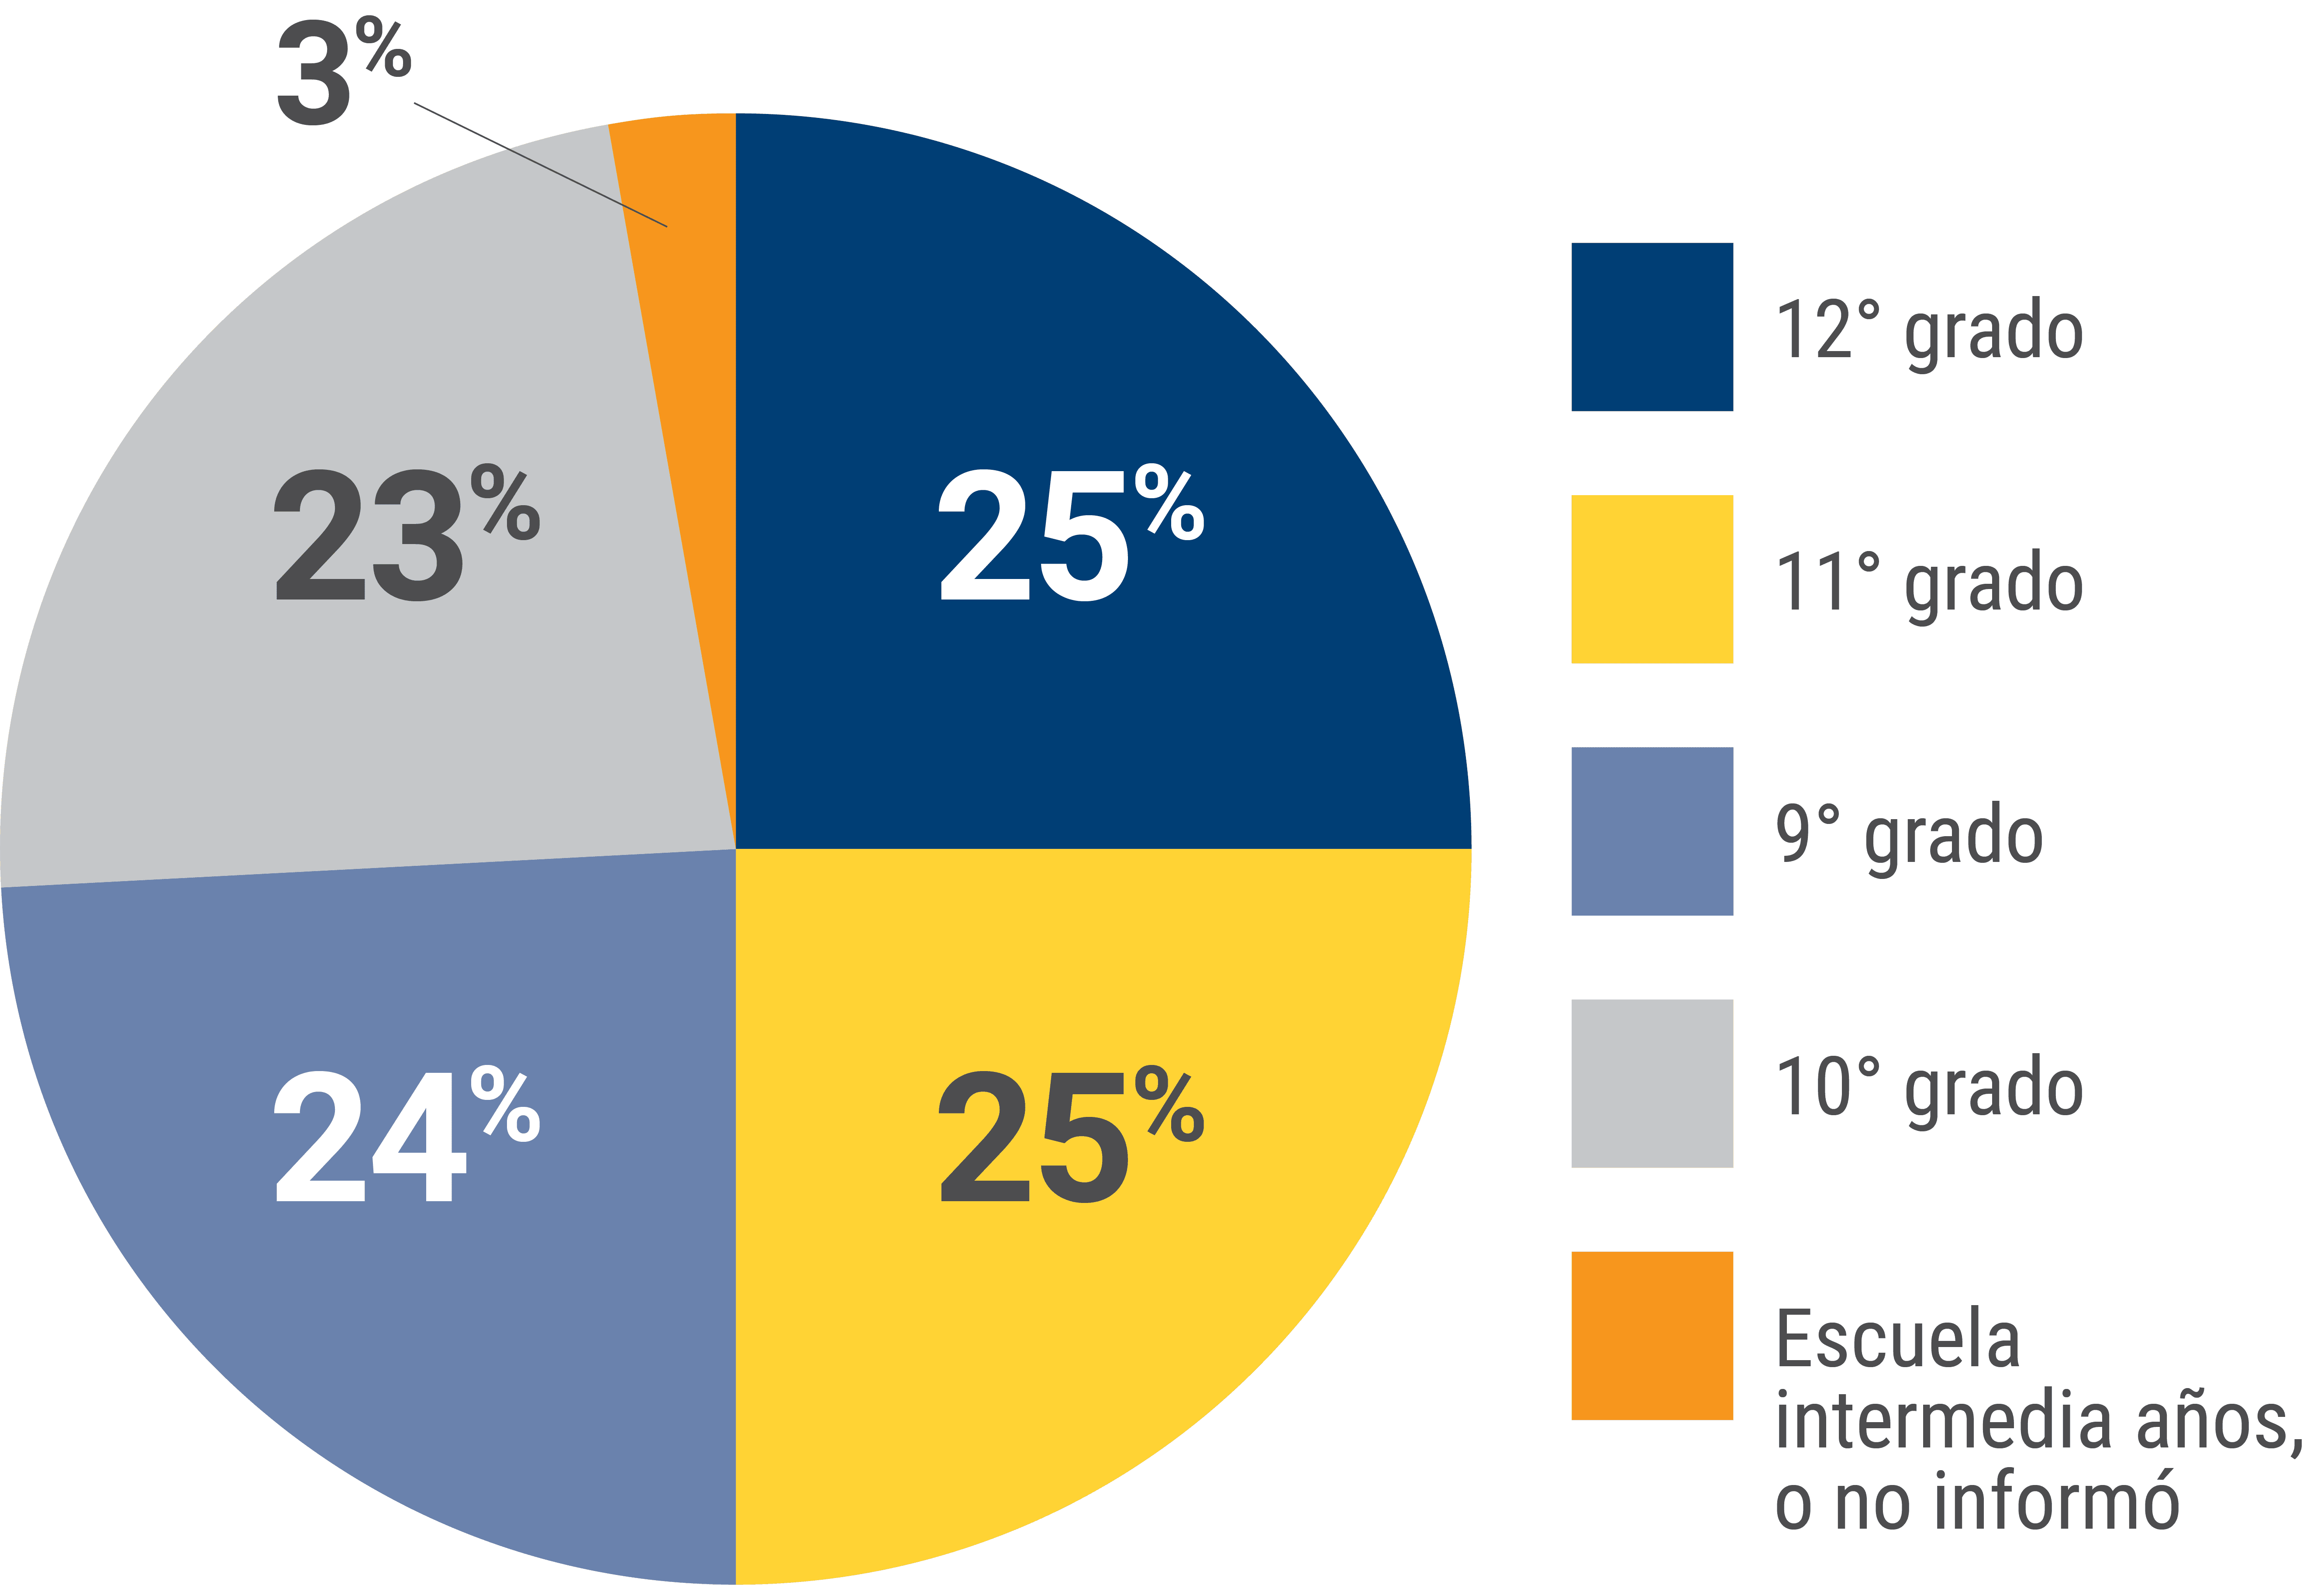
El nivel de grado de los hijos mayores de los encuestados se dividió de manera uniforme entre los grados de la escuela secundaria. El 3% de las respuestas fueron de padres de escuela intermedia, que es aproximadamente la misma proporción de estudiantes de escuela intermedia en la red (2.4%).
La encuesta consistió en preguntas sobre los temas enumerados a continuación.
La encuesta consistió en preguntas sobre los temas enumerados a continuación.
RESPONSABILIDAD Y CULTURA
RESPONSABILIDAD Y CULTURA
Casi 9 de cada 10 familias están de acuerdo en que la cultura escolar de sus hijos es predecible, consistente y promueve el aprendizaje.
CLIMA ESCOLAR
CLIMA ESCOLAR
Más de 7 de cada 10 familias sienten que los administradores crean un entorno escolar que ayuda a sus hijos a aprender.
SEGURIDAD ESCOLAR
SEGURIDAD ESCOLAR
La mayoría de las familias se preocupan por la violencia en las escuelas; sin embargo, más de 6 de cada 10 familias creen que sus hijos generalmente se sienten seguros en la escuela.
APTITUD ESCOLAR
APTITUD ESCOLAR
Tres de cada cuatro familias sienten que su escuela está preparando a su estudiante para el próximo año académico.
PARTICIPACIÓN FAMILIAR
PARTICIPACIÓN FAMILIAR
Más de 8 de cada 10 familias tienen al menos un miembro del personal de confianza en la escuela de su hijo.
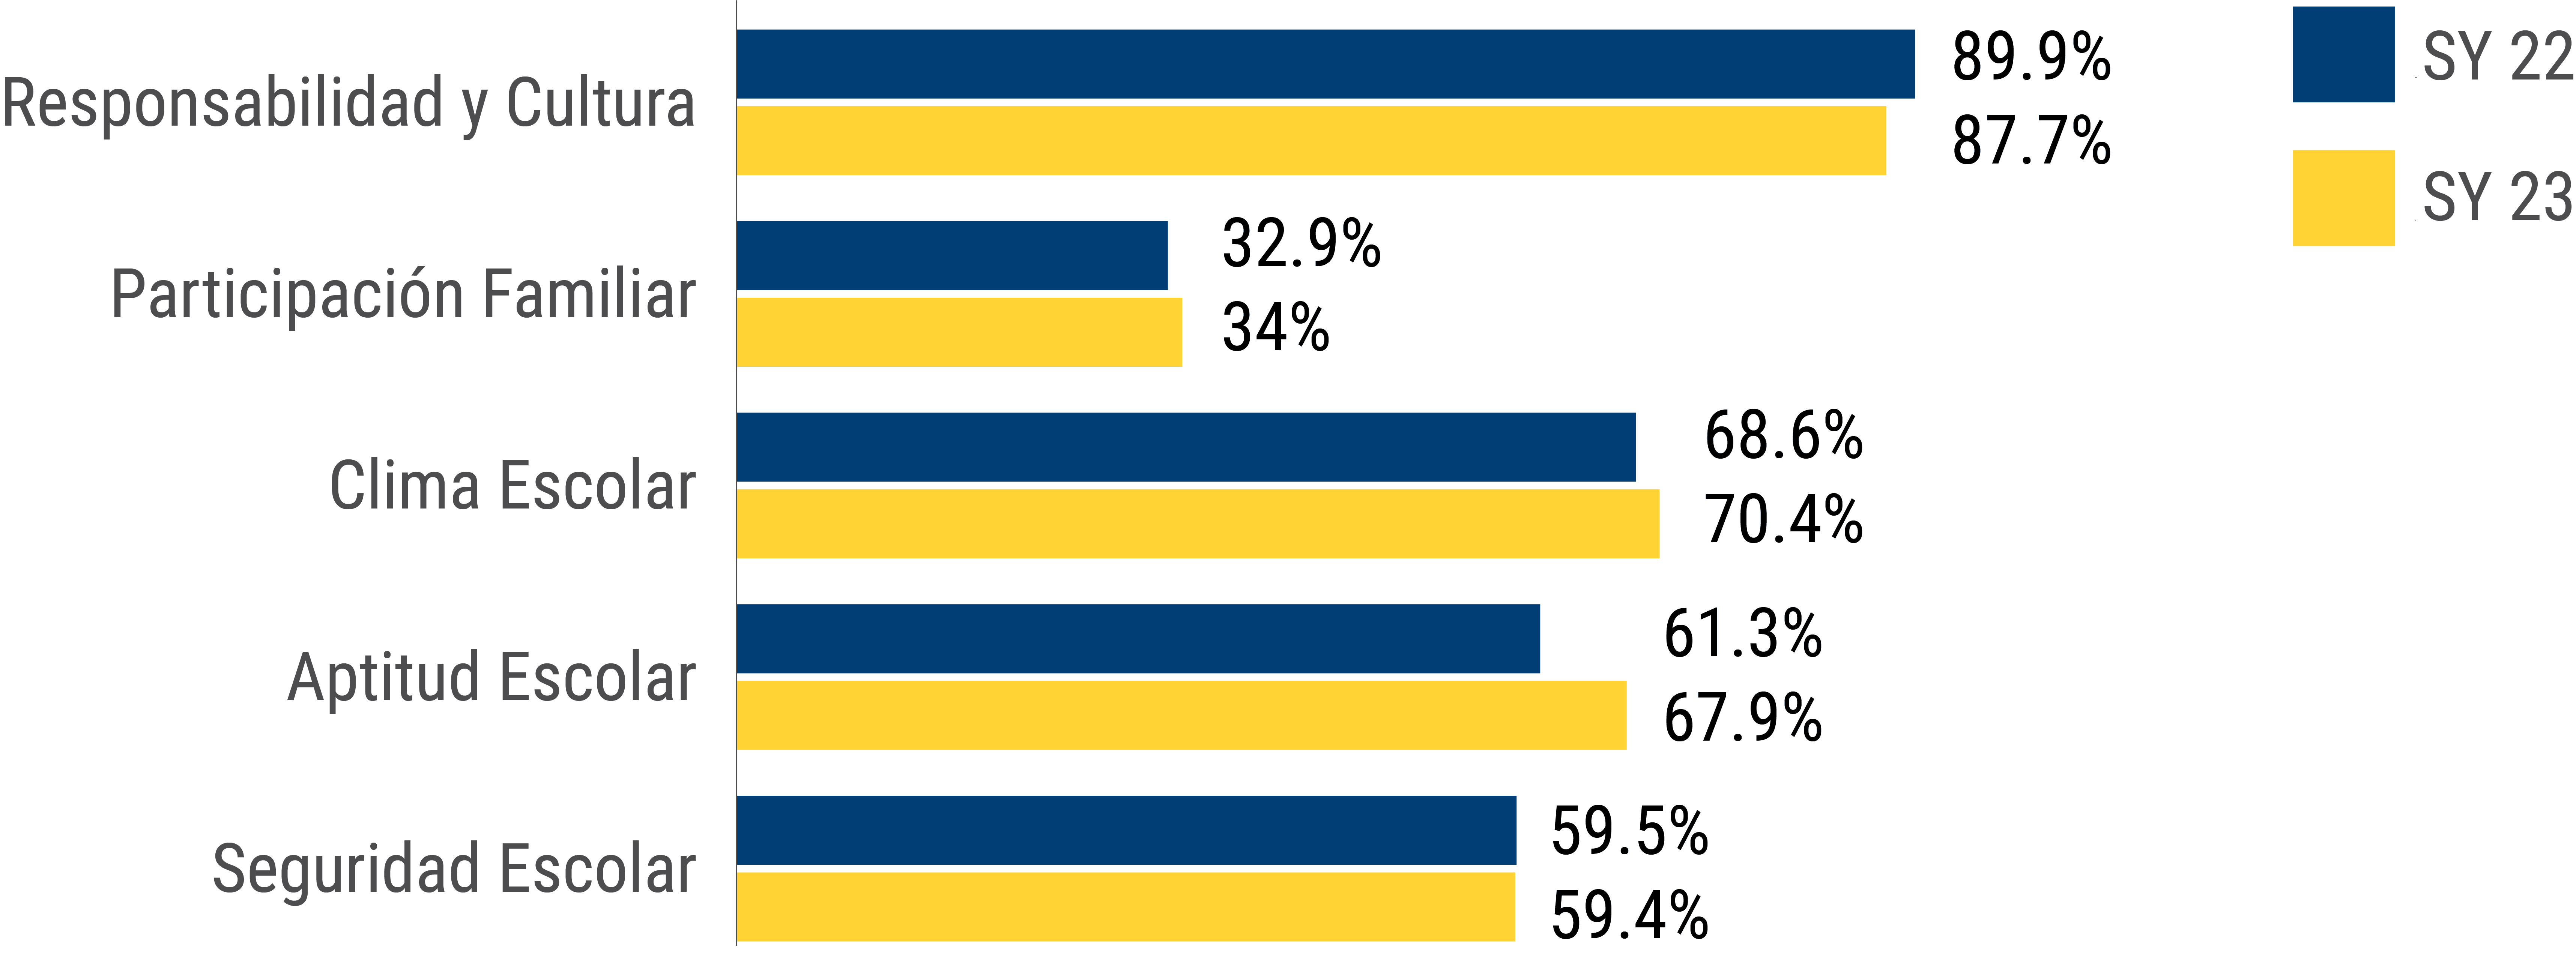
La mayoría de los temas de preguntas tuvieron una preferencia similar a la del año anterior, con la excepción de Aptitud Escolar, que aumentó más del 6% en términos de favorabilidad, lo que definimos como responder “totalmente de acuerdo” o “de acuerdo” a una pregunta. La favorabilidad temática más baja fue nuevamente Participación Familiar, con 34% (1.1 % más que el año anterior), y la más alta fue nuevamente Responsabilidad y Cultura con 87.7% (2.2% más bajo que el año anterior).
Dentro de Seguridad Escolar, los padres se preocupan menos por la violencia en la escuela que el año pasado (3.3% más que el año anterior), pero informan que su hijo se siente más inseguro que el año pasado (6.1% menos que el año anterior), aunque la favorabilidad de la seguridad escolar para los niños seguía siendo superior a la preocupación de los padres (64.3% frente a 37.9%).
PRÓXIMOS PASOS
PRÓXIMOS PASOS
-
Este documento ha resumido los datos para todas las familias en todas las escuelas. Para comprender los datos específicos de la escuela, cada director organizará una reunión del Consejo Asesor de Padres (PAC) esta primavera. Comuníquese con su escuela para obtener más información.
-
El 20 de abril, durante nuestra Serie de liderazgo para padres, compartiremos más información sobre las respuestas de toda la red a todos los comentarios que hemos recopilado.
-
El equipo de Asuntos Públicomendará objetivos finales de Experiencia Familiar para nuestros compromisos en el Marco de Identidad Noble, que guiará nuestro trabajo en el año escolar 2024.
摘要
“家庭体验调查”(Family Experience Survey)旨在持续提升父母和家庭的话语权。随着我们继续成 为一个反种族主义组织,我们必须将Noble家庭的声音融入我们的工作。本文件中的数据适用于所 有“Noble学校”(Noble Schools)。校园特定数据将于整个春季期间在“家长咨询委员会”(PAC)会 议中分享。在这里,我们概述了我们从我们所有的学校的家庭那里听到的、关于我们在执行我们的 共同使命及价值观方面做得如何的意见。
受访者的背景
受访者的背景
总共有3,886位家庭受访者提供批评性反馈。
种族/民族
种族/民族
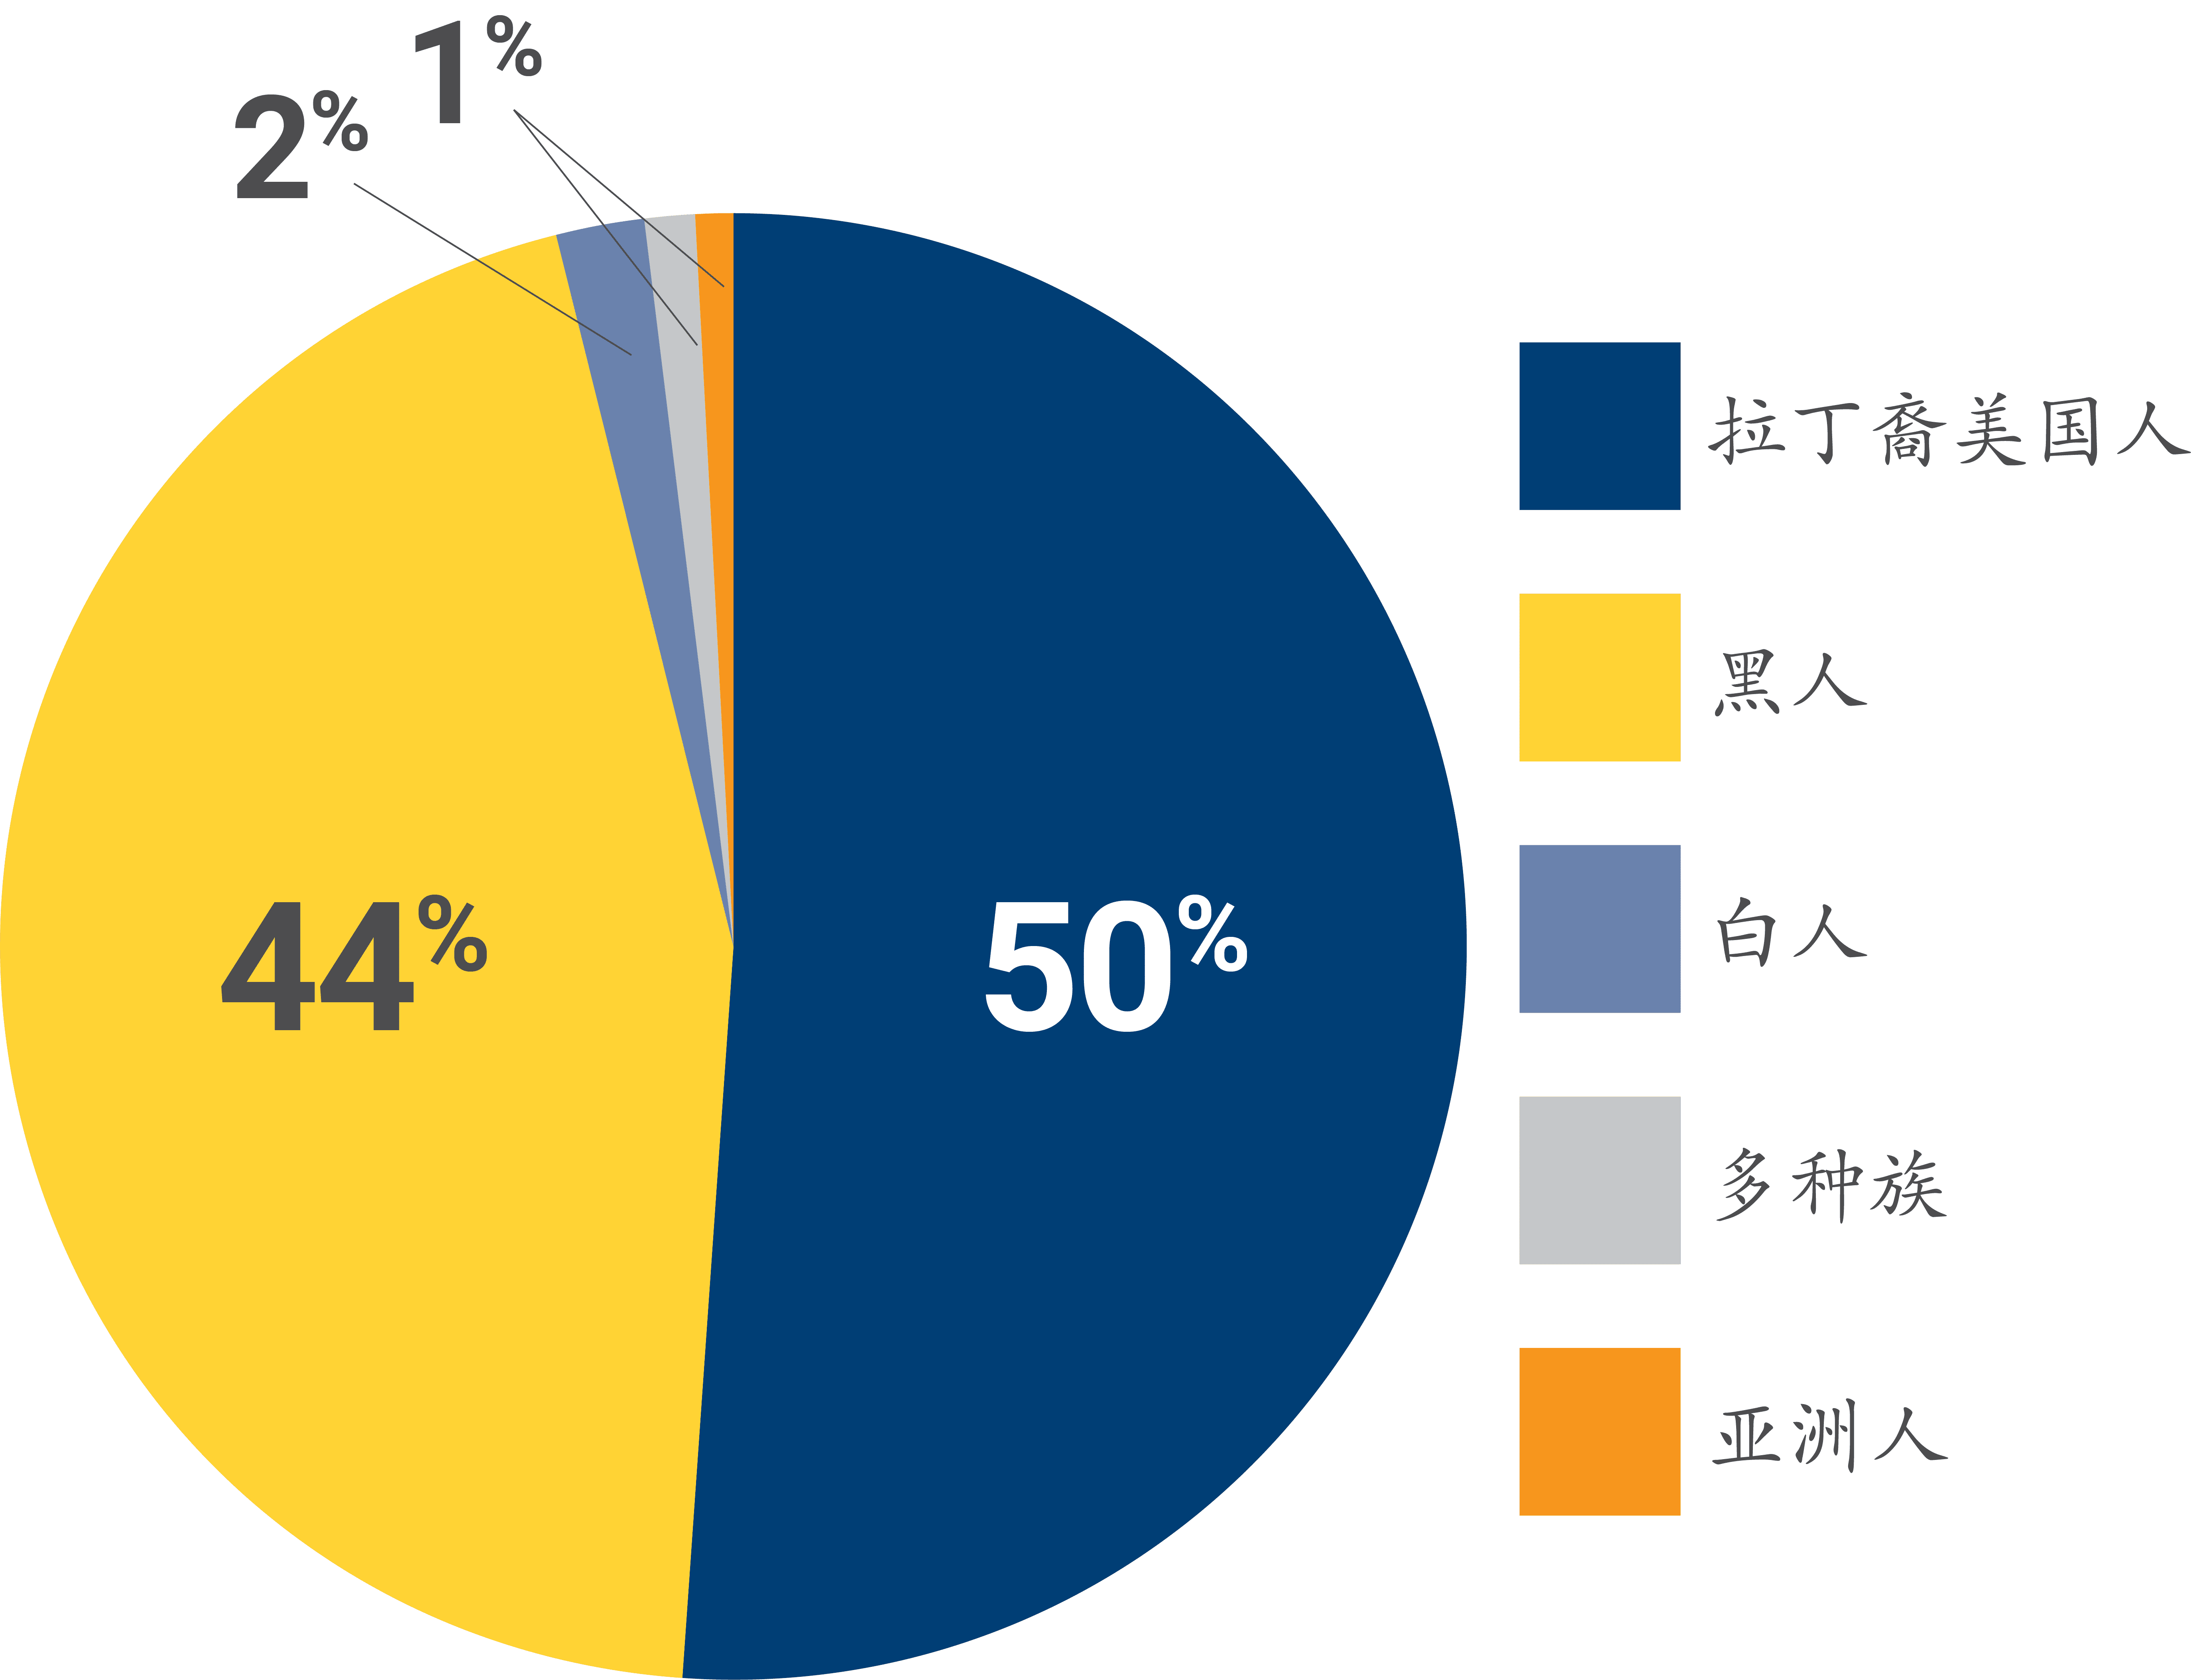
50%认同为拉丁美洲人,44%认同为黑人,2%认同为多种 族,1%认同为白人,及1%认同为亚洲人。
年龄最大孩子的年级水平
年龄最大孩子的年级水平
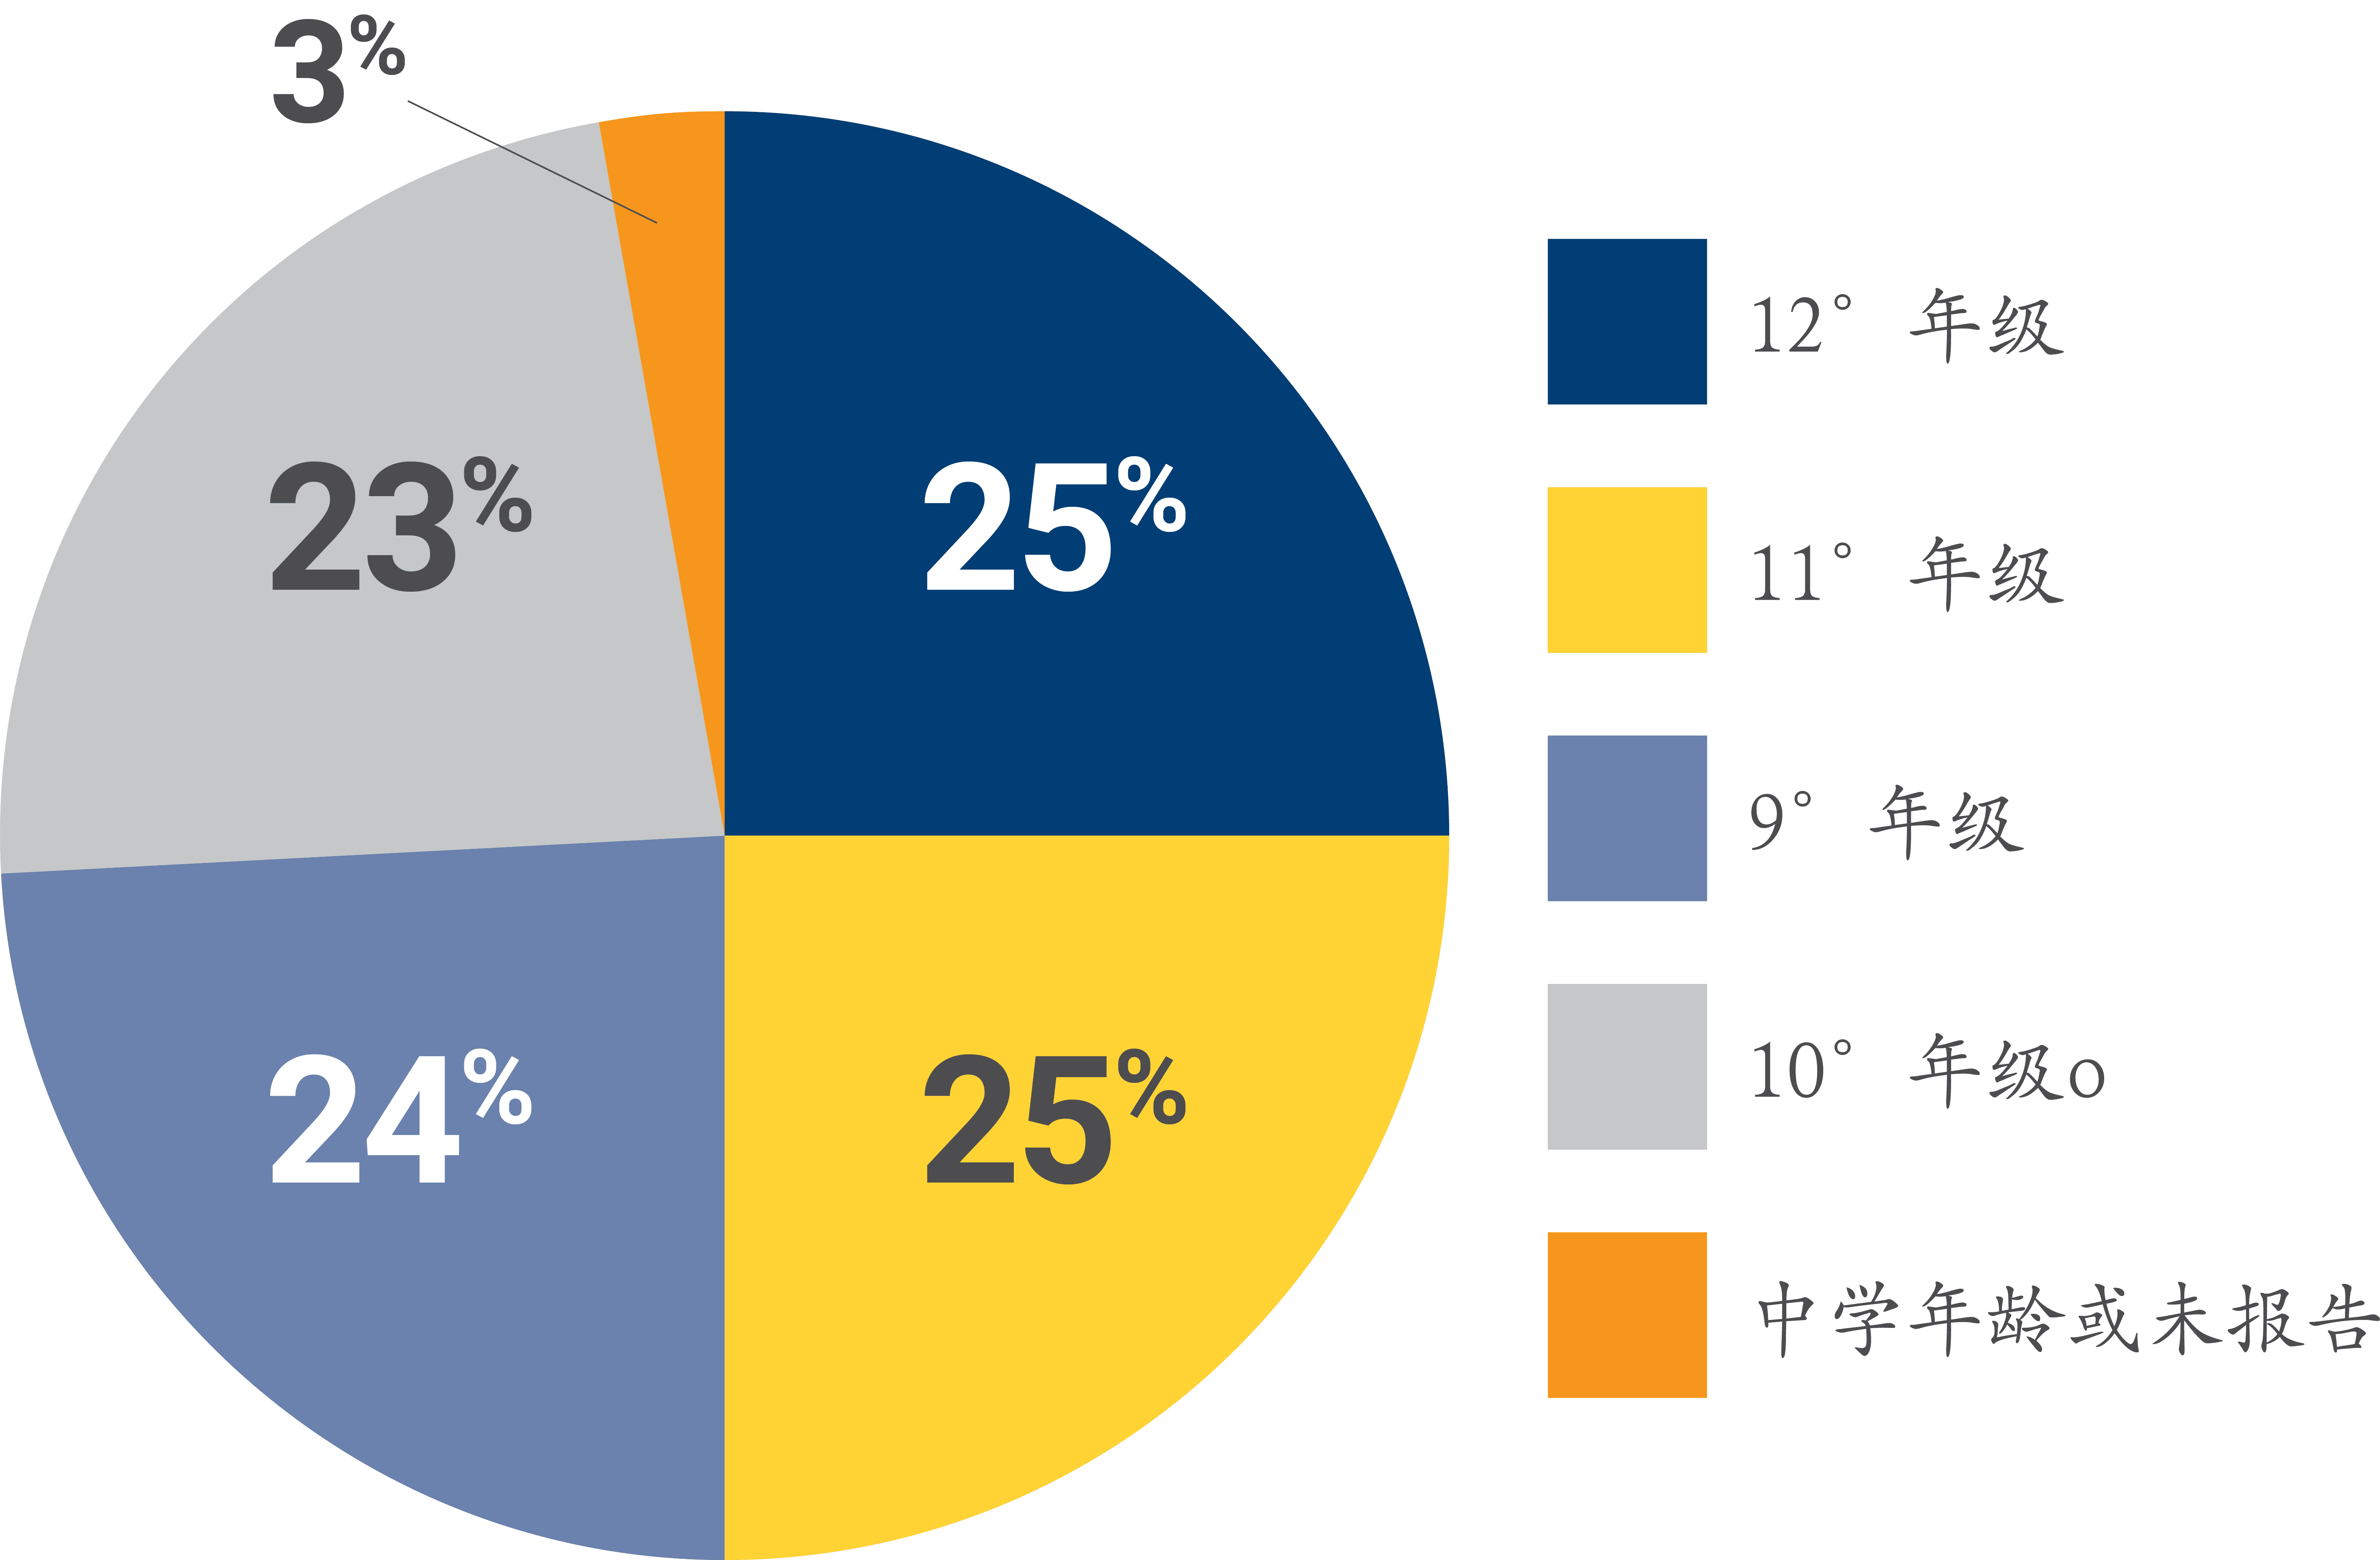
受访者的年龄最大孩子的年级水平平均分布于高中学校的 各个年级。3%的受访者来自初中学校学生的家长,这与 特许学校网络中的初中学校学生比例(2.4%)差不多。
该项调查包括关于下列课题的问题。以下列举其中一些主题:
该项调查包括关于下列课题的问题。以下列举其中一些主题:
问责制及文化
问责制及文化
近十分之九的家庭同意他们孩子的 学校文化可预测、始终一致,而且 促进学习。
学校氛围
学校氛围
超过十分之七的家庭觉得学校 管理人员创建有助于他们孩子 学习的学校环境。
学校安全
学校安全
大多数家庭担忧学校中的暴力; 然而,超过十分之六的家庭相信 他们的孩子在学校中总体上感觉 安全。
学校合适程度
学校合适程度
四分之三的家庭觉得他们的学校正在 为他们的学生的下一学年做准备。
家庭参与
家庭参与
超过十分之八的家庭在他们孩子的学 校中至少有一位值得他们信赖的工作 人员。
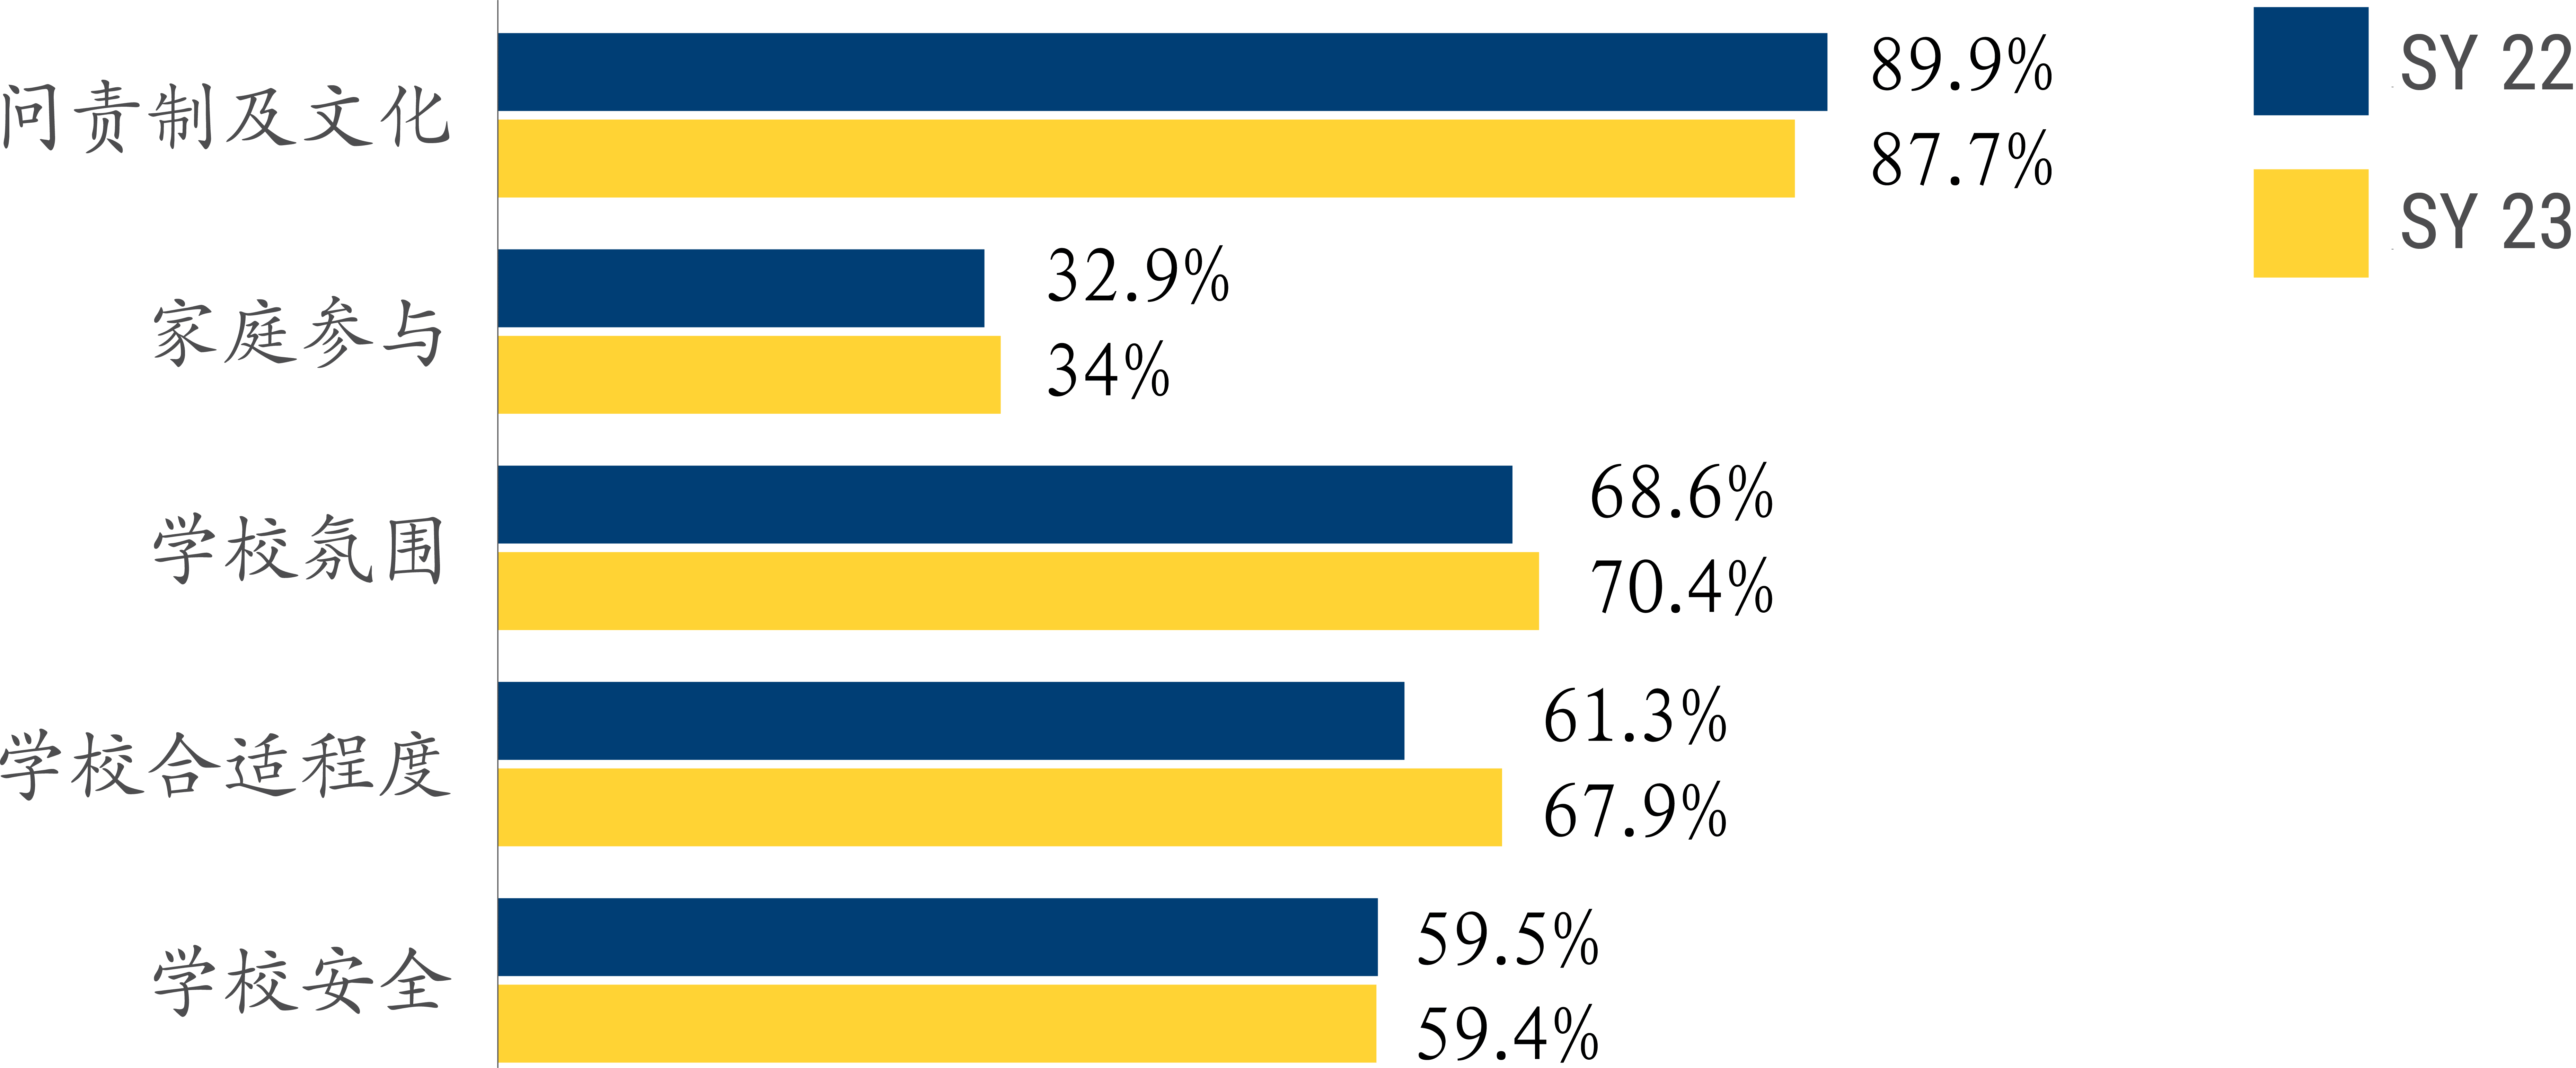
大多数问题的课题的赞同率与上一年相似,除了“学校合适程度”之外,而“学校 合适程度”的赞同率增加了6% – 我们将之定义为对一问题回答“强烈同意”或“同 意”。最低的课题赞同率再次为“家庭参与”,为34%(比上一年高1.1%),而最 高的课题赞同率再次为“问责制及文化”,为87.7%(比上一年低2.2%)。 在“学校安全”范围内,与去年相比,家长们较少担忧学校中的暴力(比上一年 低3.3%),但他们报告说他们的孩子感觉比去年更不安全(比上一年低6.1%) ,虽然孩子感觉安全的赞同率还是高于家长的担忧(64.3%对37.9%)。
接下来的步骤
接下来的步骤
- 本文件概述了所有学校的 所有家庭的数据。为理解学校 特定数据,每位校长将在这个 春季主持一“家长咨询委员会” (PAC)会议。请与您的学校 联系,以获知更多信息。
- 在4月2日,在我们的“家长 领导系列”(Parent Leadership Series)期间,我们将分享更多 关于整个特许学校网络对我们 所收集的所有反馈的回应。
- “公共事务小组”(Public Affairs team)将为我们 在“Noble身份认同框架” (Noble Identity Framework) 中的承诺建议最终的“家庭 体验”(Family Experience) 目标,这些目标将引导我们 在“2024学年”的工作。


