SUMMARY
The Family Experience Survey aims to consistently elevate the parent and family voice.
As we continue to become an antiracist organization, we must integrate the voice of Noble families into our work. The data in this document is for all Noble Schools. Campus-specific data will be shared in Parent & Guardian Advisory Council (PAC) meetings throughout the Spring. Here, we outline what we heard from our families across all of our schools about how we are executing our shared mission and values.
BACKGROUND OF RESPONDENTS
A total of 4,027 family respondents provided critical feedback.
RACE/ETHNICITY
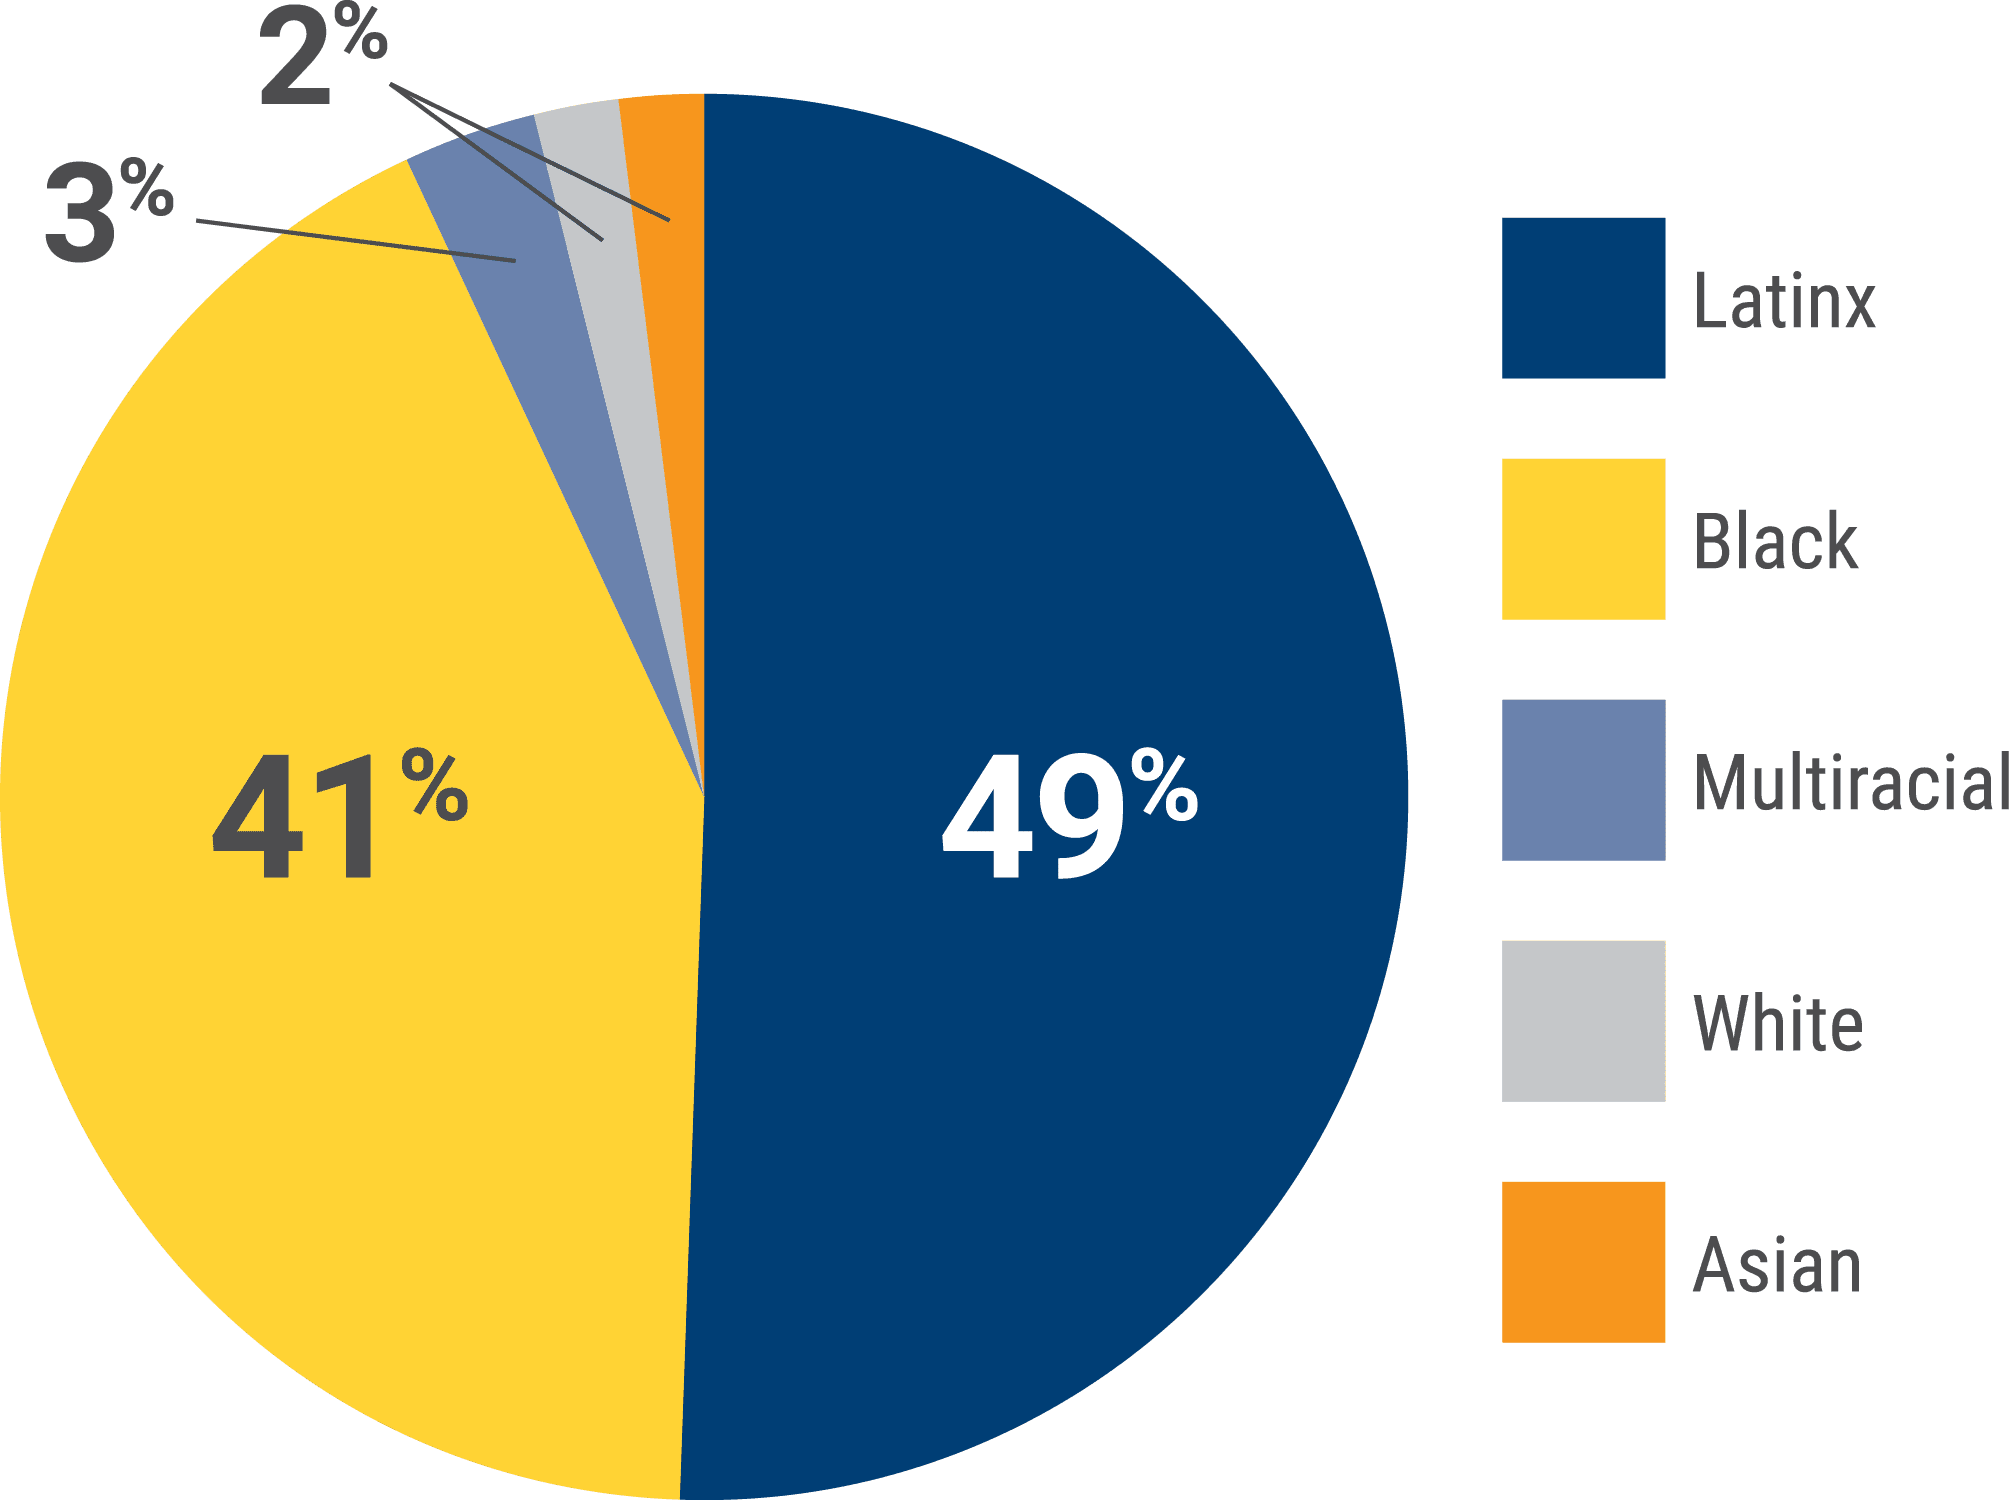
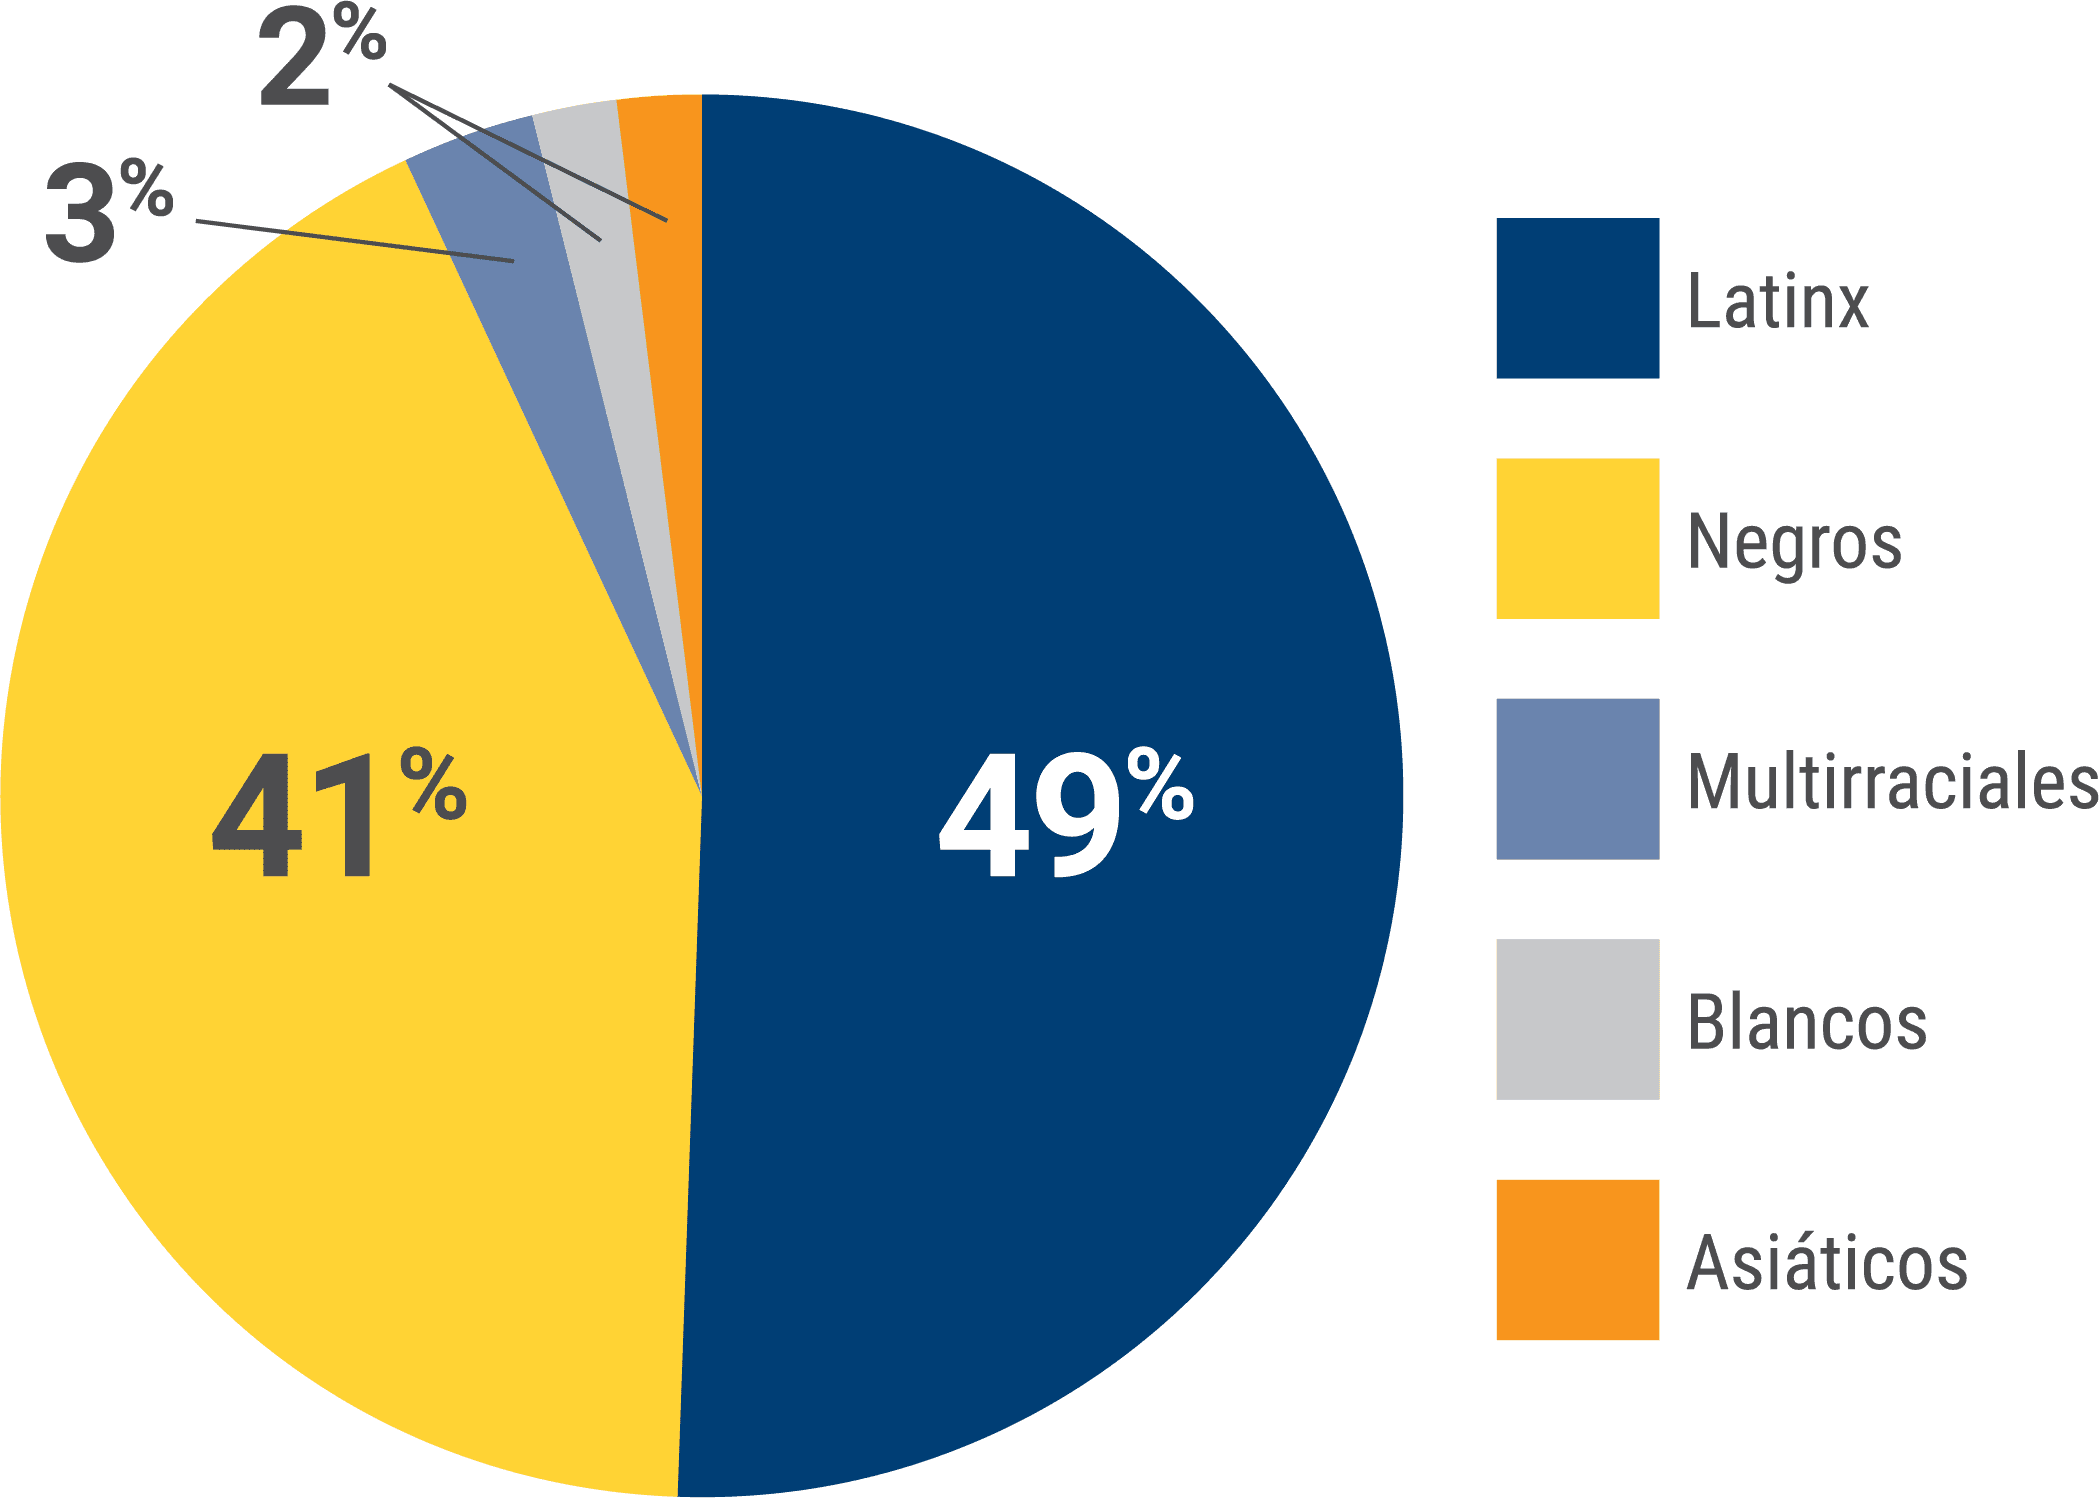
49% identified as Latinx, 41% as Black, 3% as Multiracial, 2% as White, and 2% as Asian.
GRADE LEVEL OF OLDEST CHILD
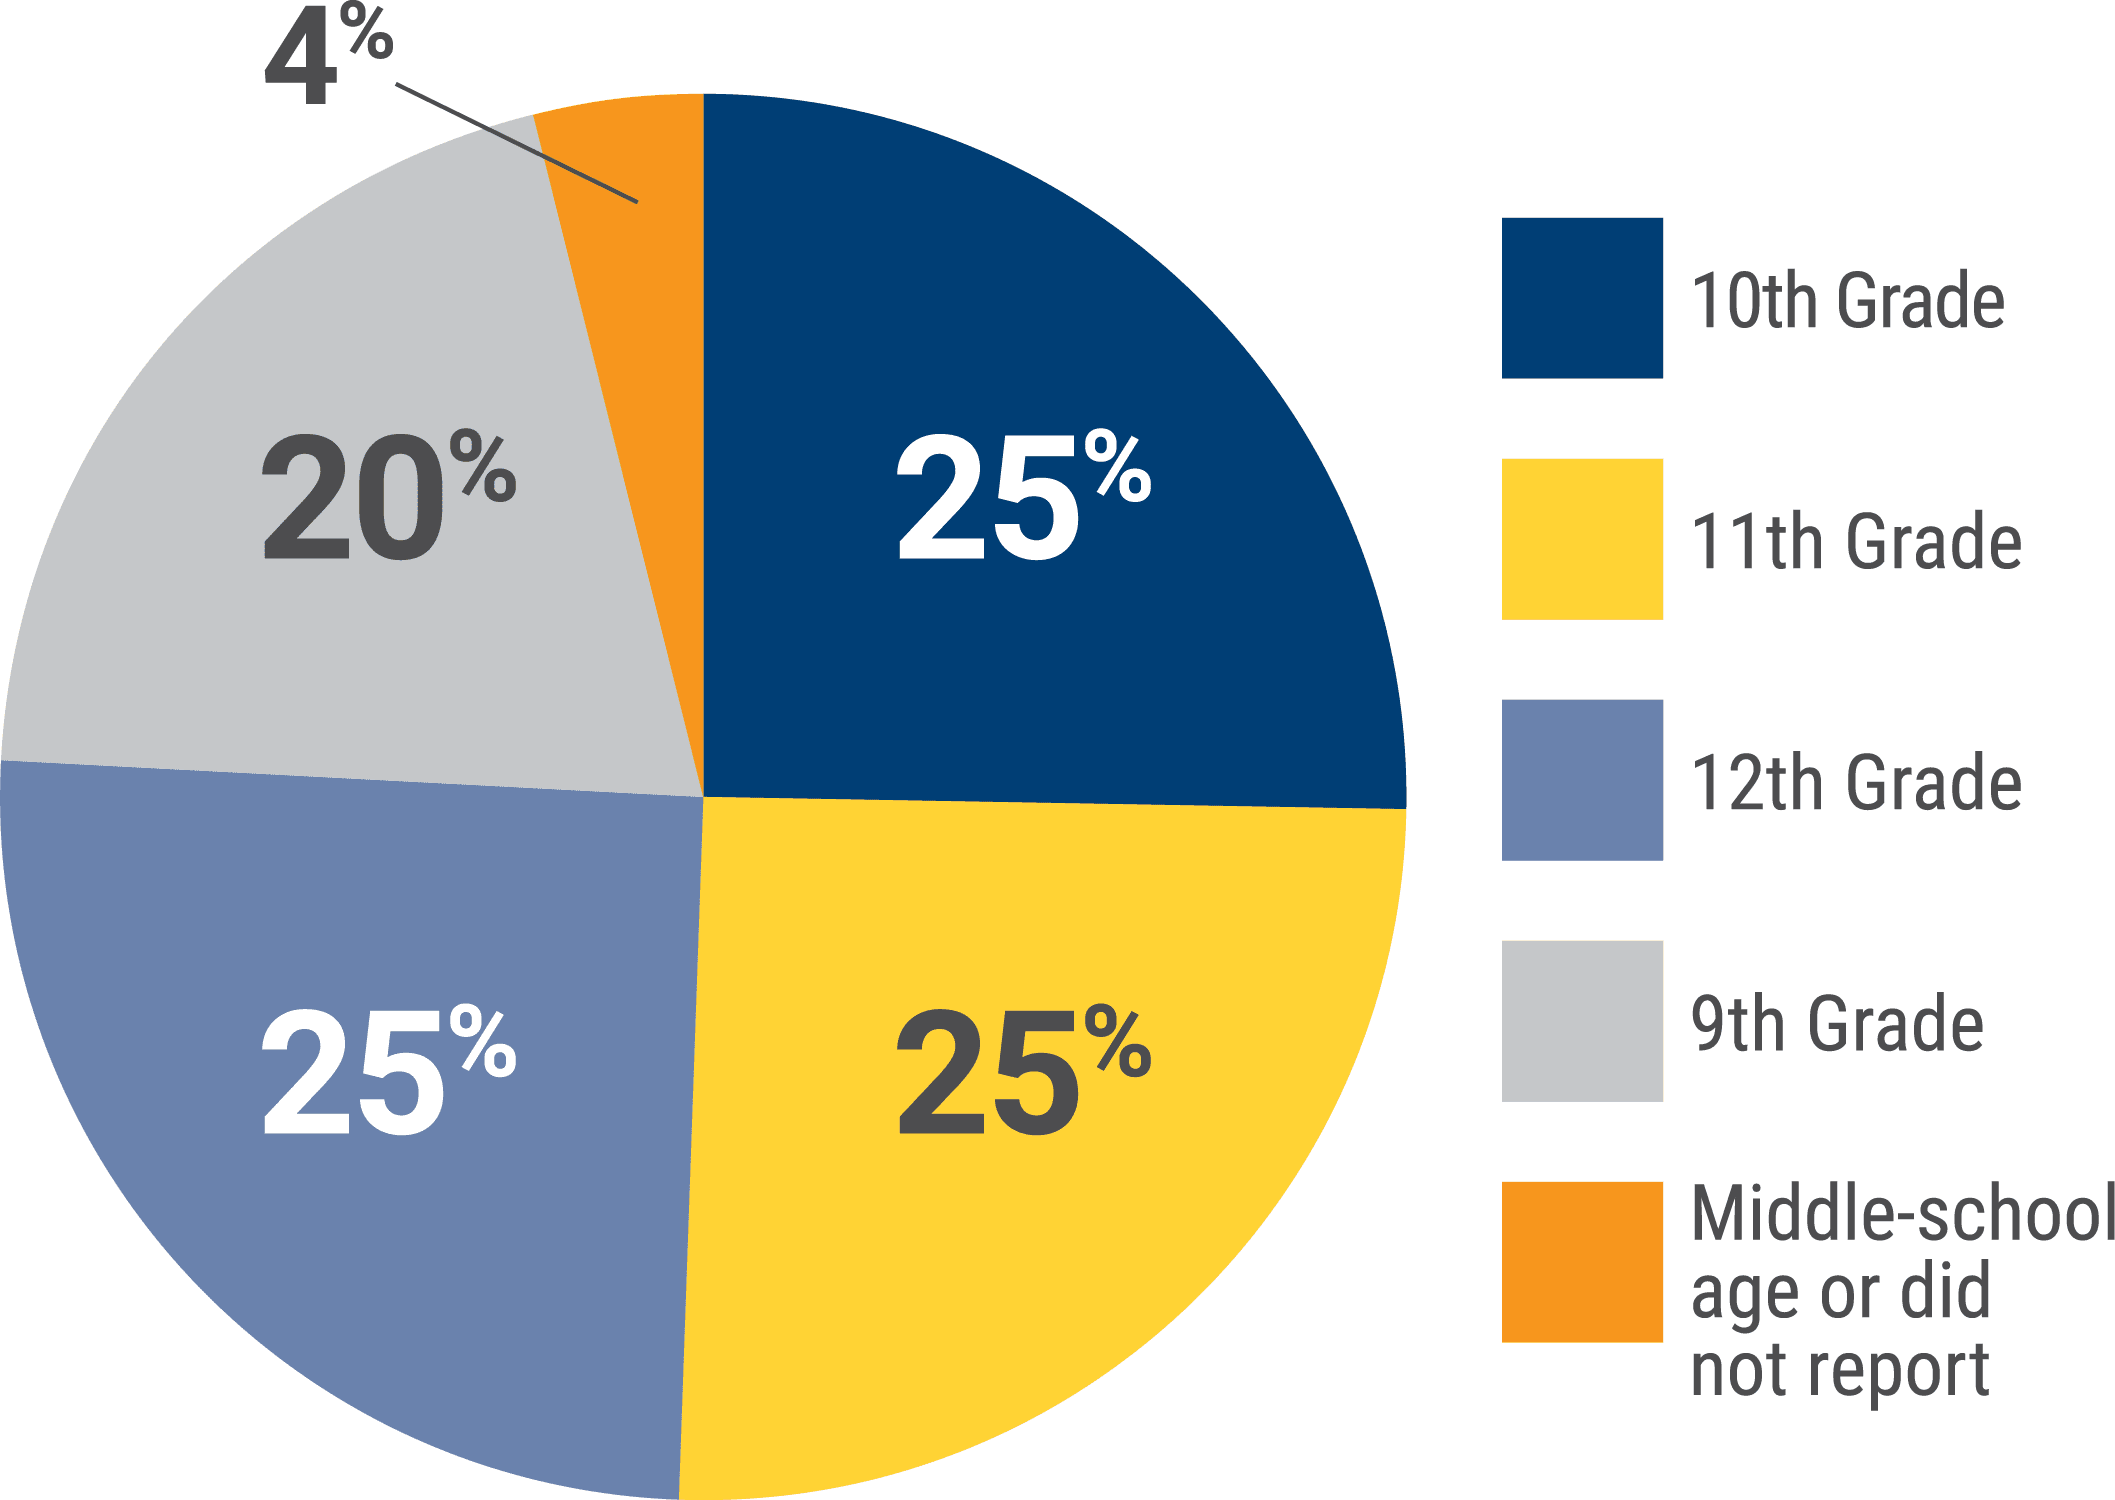
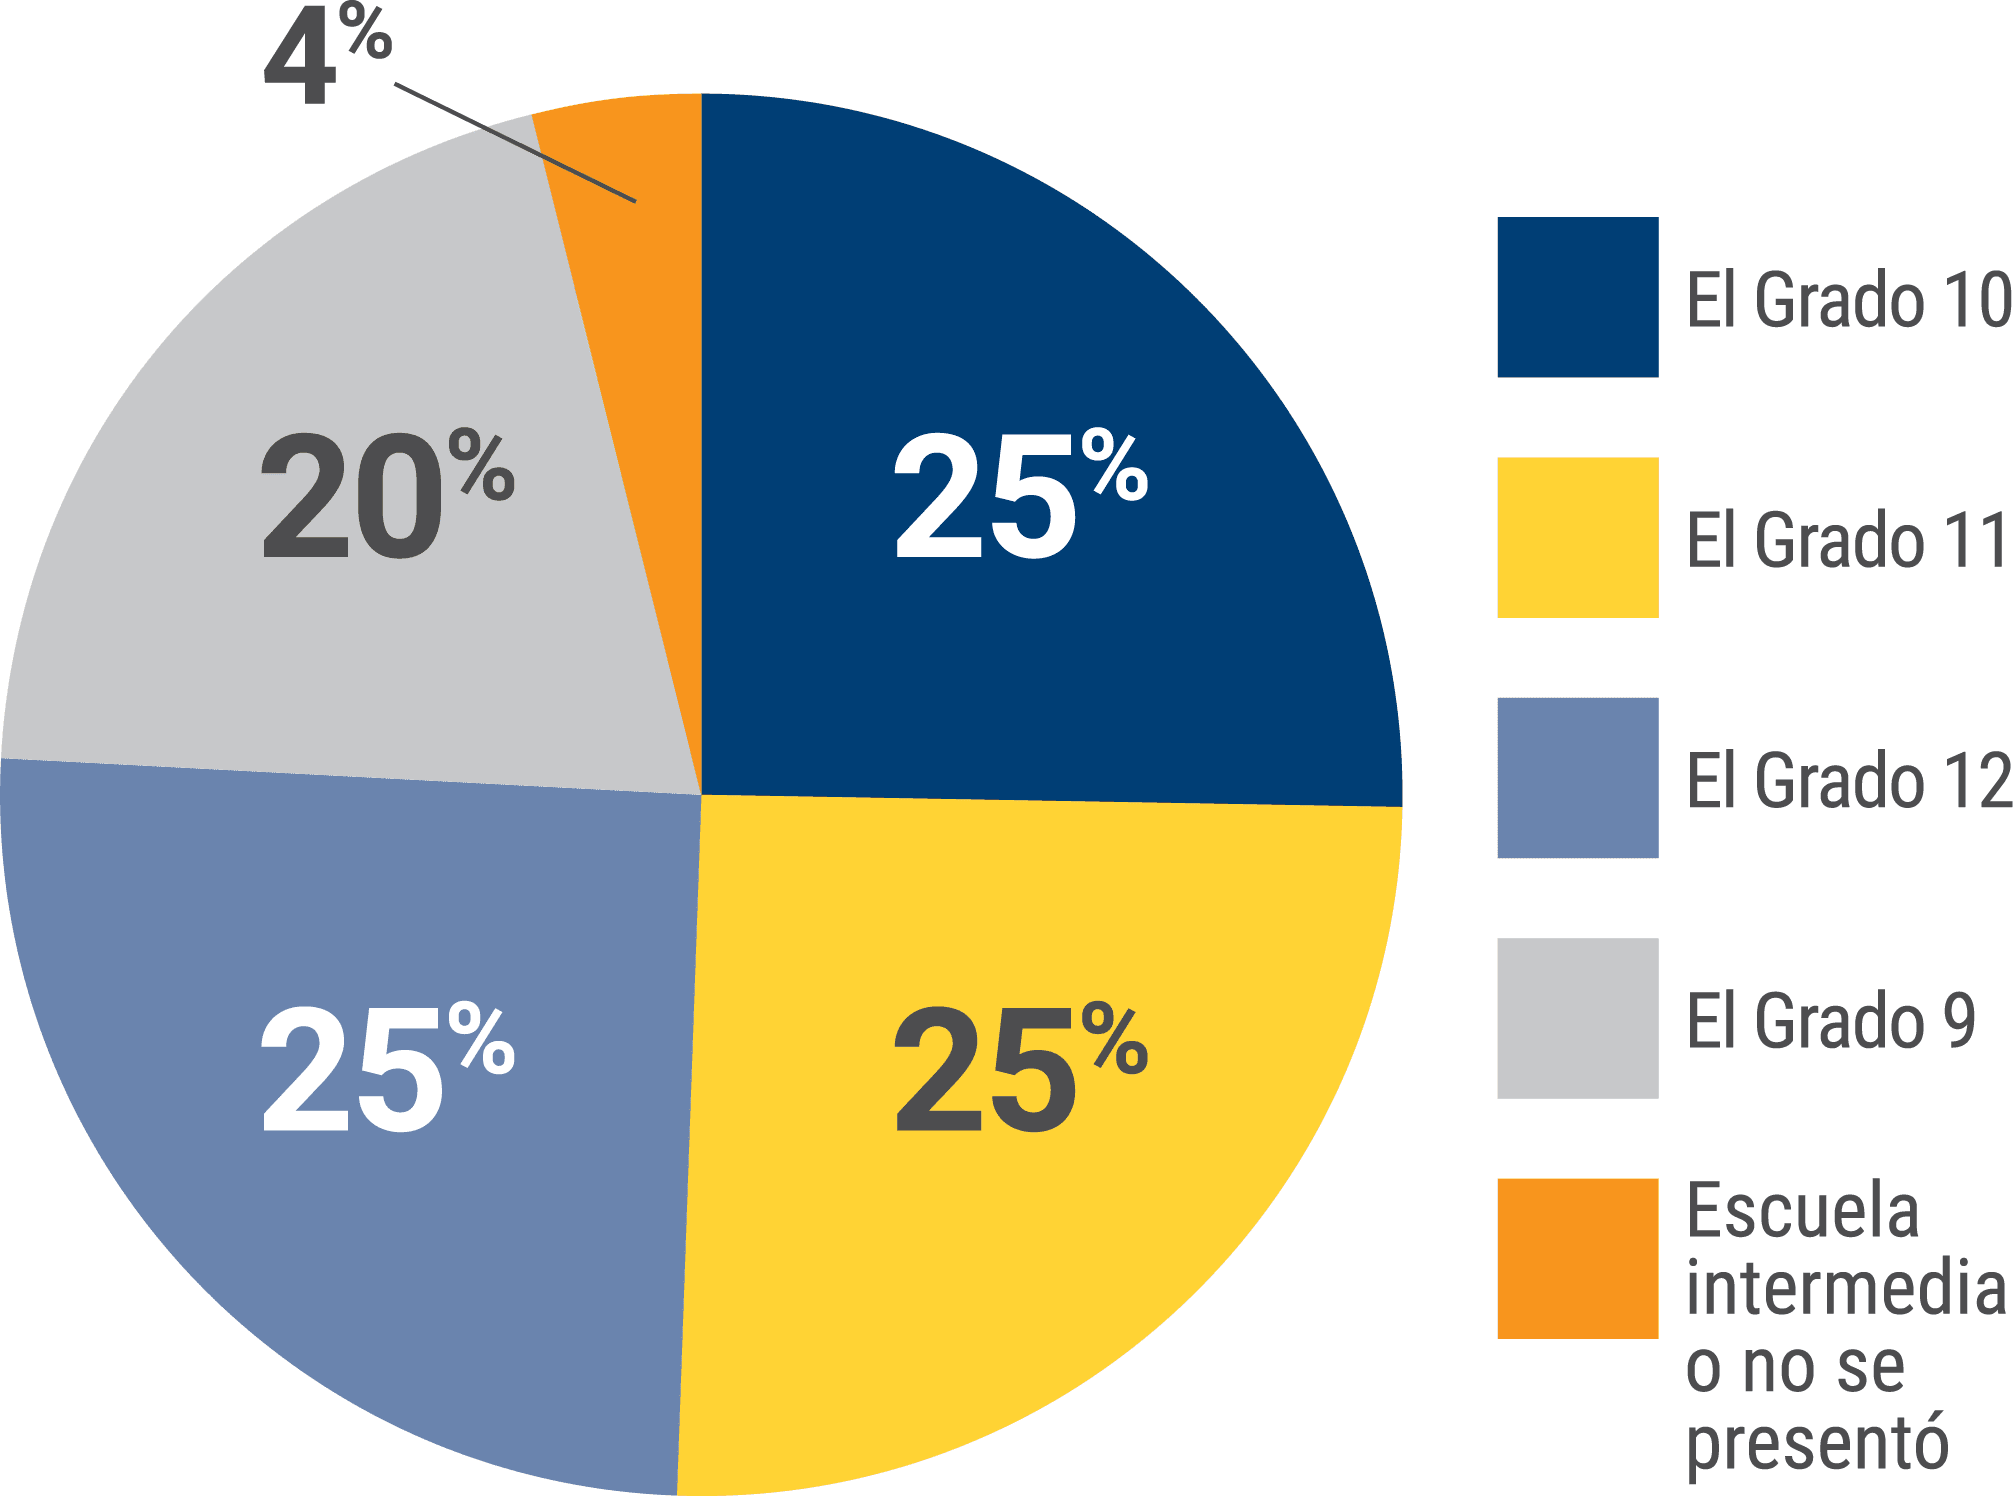
Roughly equal portions said their oldest student was in 10th, 11th, or 12th grade, at about 25% each.
20% had a 9th-grade student.
The remaining 4% were middle-school age or did not report.
The survey consisted of questions on the topics listed below.
Here are some of the themes:

ACCOUNTABILITY & CULTURE
Nearly 9 in 10 families agree that their child’s school provides a predictable and consistent culture.

SCHOOL CLIMATE
Almost 8 in 10 families indicate that they believe teachers have respect for their children, while only 6 in 10 believe that their children are enjoying school.

SCHOOL FIT
Slightly more than half of the families indicate that their student is not comfortable asking adults for help at their school.

SCHOOL SAFETY
The majority of families worry about violence in schools; however, the vast majority (7 in 10) believe their child generally feels safe in school.

FAMILY ENGAGEMENT
While over 3 in 4 families feel they have at least one trusted staff member on campus, less than 1 in 4 feel connected to, involved, or physically present in schools.
Additionally, we asked for feedback through open-response around some of Noble’s policies:
Additionally, we asked for feedback through open-response around some of Noble’s policies:
Dress Code: There were about an equal number of comments from those who approved of the new dress code and thought it worked well and those who disapproved and expressed a desire to return to Noble’s previous dress code policy.
Cell Phone Usage: Feedback on cell phone usage was also split. Nearly half of responses cited safety concerns at school as the reason why students should always have access to phones, while almost the other half thought cell phones should be limited to emergencies and/or are generally a distraction to students.
School Culture: The top themes that emerged included a desire for better communication with students (checking in on them individually, hearing more student voices) and offering more activities for students.
RESUMEN
RESUMEN
La Encuesta de experiencia familiar tiene como objetivo elevar constantemente la voz de los padres y la familia. A medida que continuamos convirtiéndonos en una organización antirracista, debemos integrar la voz de las familias de Noble en nuestro trabajo. Los datos en este documento corresponden a todas las Escuelas de Noble. Los datos específicos del campus se compartirán en las reuniones de PAC durante la primavera. Aquí, describimos lo que expresan las familias de todas nuestras escuelas sobre la manera en que estamos ejecutando nuestra misión y valores compartidos.
ANTECEDENTES DE LOS ENCUESTADOS
ANTECEDENTES DE LOS ENCUESTADOS
Un total de 4,027 familiares encuestados proporcionaron respuestas fundamentales.
RAZA/ORIGEN ÉTNICO
RAZA/ORIGEN ÉTNICO
El 49 % se identificó como latinx, el 41 % como negros, el 3 % como multirraciales, el 2 % como blancos y el 2 % como asiáticos.
NIVEL ESCOLAR DEL HIJO MAYOR
NIVEL ESCOLAR DEL HIJO MAYOR
Partes aproximadamente iguales afirmaron que su hijo mayor estaba en el grado 10, 11 o 12, con alrededor del 25% correspondiente a cada uno de estos grados.
El 20% afirmó tener un estudiante en 9 grado
El 4% restante estableció que su hijo se encontraba en edad de escuela intermedia o no se presentó.
La encuesta consistió en preguntas sobre los temas detallados a continuación.
Estos son algunos de los temas:
La encuesta consistió en preguntas sobre los temas detallados a continuación.
Estos son algunos de los temas:

RESPONSABILIDAD Y CULTURA
RESPONSABILIDAD Y CULTURA
Aproximadamente 9 de cada 10 familias están de acuerdo en que la escuela de su hijo ofrece una cultura predecible y consistente.

AMBIENTE ESCOLAR
AMBIENTE ESCOLAR
Alrededor de 8 de cada 10 familias consideran que los maestros respetan a sus hijos, mientras que solo 6 de cada 10 creen que sus hijos disfrutan de la escuela.

ADAPTACIÓN ESCOLAR
ADAPTACIÓN ESCOLAR
Un poco más de la mitad de las familias indican que su hijo no se siente cómodo al pedir ayuda a los adultos en su escuela.

SEGURIDAD ESCOLAR
SEGURIDAD ESCOLAR
La mayoría de las familias se preocupan por la violencia en las escuelas; sin embargo, la gran mayoría (7 de cada 10) considera que su hijo generalmente se siente seguro en la escuela.

COMPROMISO FAMILIAR
COMPROMISO FAMILIAR
Si bien más de 3 de cada 4 familias sienten que cuentan con al menos una persona de confianza dentro del personal en el campus, menos de 1 de cada 4 se sienten conectadas, involucradas o físicamente presentes en las escuelas.
Además, solicitamos comentarios a través de una respuesta abierta sobre algunas de las políticas de Noble:
Además, solicitamos comentarios a través de una respuesta abierta sobre algunas de las políticas de Noble:
Código de vestimenta: Hubo casi la misma cantidad de comentarios tanto por parte de quienes aprobaron el nuevo código de vestimenta y consideraron que funcionaba bien como por parte de quienes lo desaprobaron y expresaron su deseo de volver a la política de código de vestimenta anterior de Noble.
Uso del teléfono celular: Los comentarios sobre el uso del teléfono
celular también estuvieron divididos. Casi en la mitad de las respuestas se mencionaron las preocupaciones de seguridad en la escuela como la razón por la cual los estudiantes siempre deben tener acceso a los teléfonos, mientras que en casi la otra mitad se indicó que los teléfonos celulares deberían limitarse a emergencias y/o generalmente son una distracción para los estudiantes.
Cultura escolar: Los principales temas que surgieron incluyeron el deseo de una mejor comunicación con los estudiantes (estar pendientes de ellos en forma individual, escuchar más las voces de los estudiantes) y ofrecer más actividades para los estudiantes.
SUMMARY
“家庭经验调查问卷” (Family Experience Survey) 的目的在于始终如一地提升家长及家庭的话 语权。在我们继续成为一个反种族主义组织之时,我们必须将Noble家庭的声音融入我们的工作中。本文件中的数据适用于所有的Noble学校。校园特定数据将在整个春季的 “家长咨询委员会” (PAC) 会议上分享。在这里,我们概述了我们从我们的所有学校的家庭那里听到的关于我们l如何执行共同使命及价值观的意见。
受访者的背景
受访者的背景
总共4,027位家庭受访者提供批判性反馈
种族/民族
种族/民族
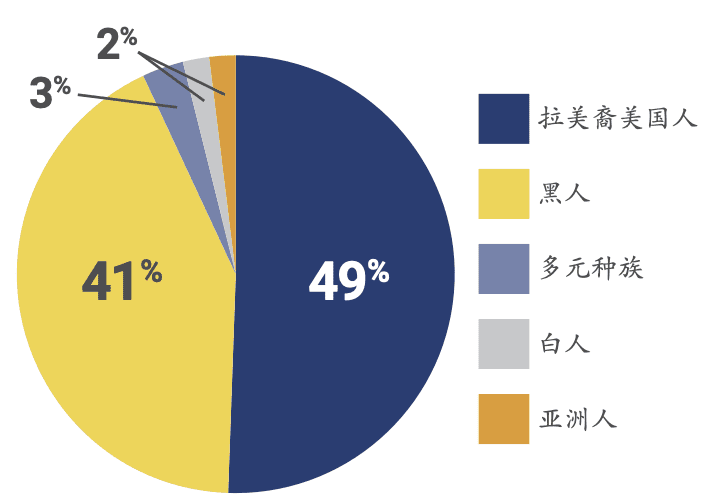
49%的受访者自称为拉美裔美国人、41%的受 访者自称为黑人、3%的受访者自称为多元种 族、2%的受访者自称为白人以及2%的受访者自 称为亚洲人。
最年长孩子的就读年级
最年长孩子的就读年级
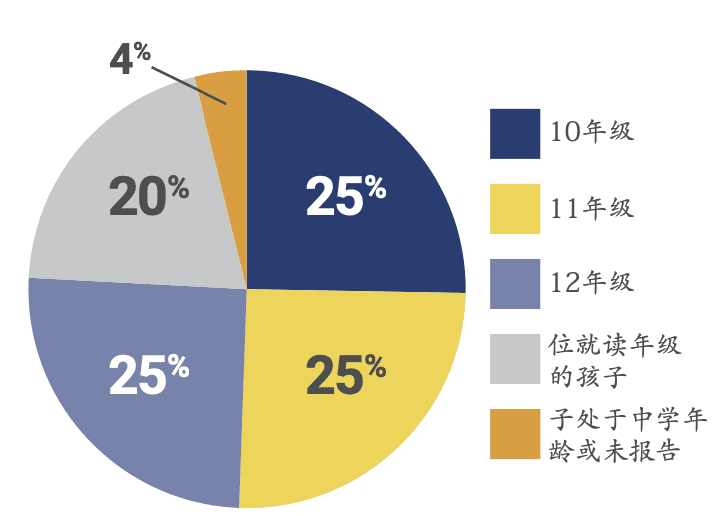
大致相等比例的受访者说他们的最年长孩子就读 10年级、11年级或12年级,这些就读年级中的每个就读年级大约25%。
20%的受访者有一位就读年级的孩子,而其余4%的受访者的孩子处于中学年龄或未报告。
该调查问卷由关于下列课题的问题组成。以下为其中一些主题:
该调查问卷由关于下列课题的问题组成。以下为其中一些主题:

问责及文化
问责及文化
10个家庭中约有9个家庭同意,他们孩子的学校提供可预测且始终如一的文化。

学校氛围
学校氛围
10个家庭中几乎有8个家庭表示,他们认为教师尊重他们的 孩子,而10个家庭中有6个家 庭认为他们的孩子很享受学校 生活。

学校适合性
学校适合性
略多于半数的受访家庭表示,他们的孩子对在他们学校向成年人寻求帮助感到不自在。

学校安全
学校安全
大多数的家庭担心学校暴力; 然而,绝大多数家庭(10个中 的7个)相信,他们的孩子在 学校里一般地感觉安全。

与家庭相联系
与家庭相联系
4个家庭中有3个家庭感觉,在 校园里至少有一位值得他们信 任的工作人员,而4个家庭中 有少于1个家庭感觉到在学校 里与学校相联系、有参与感、 或有存在感。

